

Last Week This Morning
- 10 Year Treasury fell back to 1.58%, breaking through the 1.62%-ish floor
- German bund up another 3bps to -0.26%
- 2 Year Treasury up 1bp to 0.16%
- LIBOR at 0.11%
- SOFR at 0.01%
- Powell said during his interview on 60 Minutes that the Fed wouldn’t consider hiking until the labor market recovery is “essentially complete”… and we are still more than 8mm jobs away from that
- He also confirmed later in the week that the Fed would begin tapering bond purchases well in advance of rate hikes
- CPI came in at a whopping 2.6% until you consider that annual data is now starting to pull in the effect of the shutdown last year
- Retail sales came in at 9.8%, the second strongest print ever (that stimmy tho!)
- Gas prices jumped 9.1%
- The J&J vaccine experienced 6 blood clots out of 7mm doses and we shut it down (one death)…I am having flashbacks to a year ago when the race to see who could care the most really started. If more than two people die as a result of not getting the J&J vaccine, was it worth it? 1 in 10,000 women develop blood clots from birth control and we haven’t shut that down.
Retail Sales
Although we didn’t quite get to the BofA forecast of 11%, stimmy-backed spending drove a 9.8% increase – the second highest on record. This was far north of the consensus 6.5% forecast.
The following discretionary spending gains highlight that not all the stimulus money went to paying for basics, like food and shelter:
- Sporting Goods (+23.5%)
- Clothing (18.3%)
- Autos (15.1%)
- Restaurants/bars (+13.4%)
- Department stores (+13.0%)
- Electronics (+10.5%)
The real reason Retail Sales is such a closely watched data point right now is that consumer spending comprises 2/3rds of GDP. Q1 will be released at the end of this month and is likely to come in around 6.0%…and it may be another six months before we have a single-digit GDP print. In fact, if Q2 comes in below 10%, it’s probably only because the stimmy pulled forward spending into Q1.
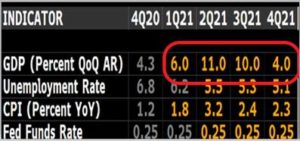
Consensus forecast for Q1 GDP is about 5.4%, while Q2 is about 8.1%. It certainly appears as though we will blow through those numbers, and I don’t think it can all be attributed to stimulus spending. The economy is normalizing very quickly and things will be going gang busters for a while.
Inflation
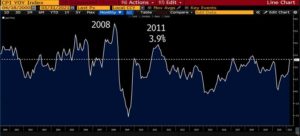
CPI came in at 2.6%, the highest level since August 2018, but well below the surge experienced after the financial crisis.
The market is already pricing in 2.5% CPI for the next five years. This means expectations would have to shift higher for rates to feel upward pressure.
Conversely, if inflation fails to meet those expectations (which is has done consistently over the last twenty years), the market will need to back that out of the 10T.
I’m in agreement with Powell on this topic. Inflation (as well as expectations) will surge this year, but fade over time. Don’t expect the Fed to suddenly shift gears just because we get a 3.0%+ CPI print in the months ahead.
10 Year Treasury
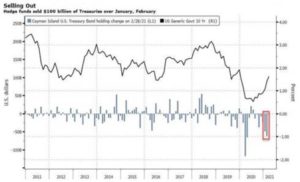
We got strong data on Thursday, which spared the largest single-day decline in 10T yields since November. There has been a large surge in Treasury shorts to start the year, particularly among hedge funds.
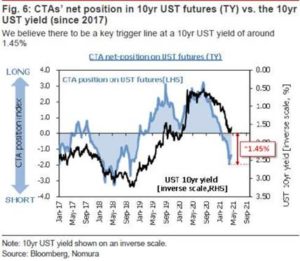
Thursday just happened to bring some significant data that failed to dramatically exceed expectations, so there was a large short covering. Nomura noted, “this recent bout of UST bull-flattening is largely a function of profit-taking and unwinds of crowded shorts and steepener positions, and as such, will likely see redeployment at “better levels” now that positioning is much cleaner…”
In other words, after loading up on short positions the last few months, we are in the midst of a mass unwind. The reset button has been pressed, making it plausible that we will experience another surge of shorts in the coming months, pressing the 10T higher and starting the process all over again.
But…should the 10T break through 1.45%, according to Nomura, it could trigger a swing to net longs and push the 10T towards 1.20%.
To be clear, this is not the base case – merely a possibility. But it highlights that market movements right now are driven far more by technical trading reactions than plain vanilla data prints.
The more likely scenario seems to be another surge of shorts as the market wonders if tapering is pulled into 2021 as GDP and payrolls improve dramatically.
Week Ahead
Pretty benign week on the data front, with no real market movers on the docket, but earning season continues. Refinitiv calculated that firms beat expectations by an average of 84% last week.
The ECB will hold rates steady, but markets will be monitoring any mention to tapering.
It will be interesting to see if the 10T breaks back through 1.62%-ish or if we are now in a new, lower range.