

Two years ago we redesigned the Pensford website to make it feel more current, headlined by a stock photo of a nice gentleman with far better hair than I wistfully staring out over the Charlotte skyline. Stock photography at its best.
Two months ago, we began another redesign. Our first call with the web designer kicked off with him saying, “Yeah, so the site is overall very good but looks to be maybe 7 or 8 years old…” Ouch. Apparently, we were stale when we launched it.
We launch the re-redesigned website today. We value functionality over techy sayings like “user experience” or “customer stories”, so hopefully you feel like the changes enhance the things you use the site for and don’t just represent a color scheme change.
New newsletter format. New website. Same irreverent tone. www.pensford.com
Some highlights include…
Forward Curve
Market forward curve with imbedded shock features, such as + 1 standard deviation, one extra hike per year, or FOMC projections. Download at will.
Cap Pricer
Interest rate cap grid pricing via downloadable excel. This isn’t meant to replace conversations with us, but if you need quick ballpark indications to plug into a model, this is a great starting point. This is actually a pretty complex model and includes customizable features like:
– impact of tenor and strike changes
– impact of different rating triggers
– month by month break down of the overall cost (eg, so you can see how much month 36 costs)
Bank Swaps vs CMBS Swaps
If you don’t want to call us, at least stop using generic online widgets to check bank swap pricing. The difference between a 10 year CMBS swap rate and a 10 year amortizing bank swap rate is about 15 basis points today, but online swap quotes are universally based on CMBS conventions. As far as we know, our site is the only site with bank swap rates.
– Brokers, we are talking to you. Your firm’s online swap rates are not accurate for bank swaps. We know you are trying to verify rates for your clients, but you are using the wrong benchmark.
– Scroll down to the Interest Rate section of the home page, click on the Swaps button, and take note of the change in rates as you toggle between Bank and CMBS swaps.
– Why are these rates different? Glad you asked:
https://www.pensford.com/resources/bank-swaps-vs-cmbs-swaps/
Graphs We Love
We frequently include graphs in our weekly newsletter, so we decided to include some of our favorites like yield curve steepness and German bund vs T10.
– we’ve included about 10 graphs that we track monthly that have historically done a good job of predicting recessions.
Pre-Trade Login
We have developed a software platform to simplify the Dodd-Frank onboarding process. Seriously, this is pretty sweet. We have a link in the top right hand corner of our home page that you’ll use to satisfy DF requirements in less than 3 minutes.
Mobile Friendly
Because so much work is now done on phones, we worked hard to make this new site mobile friendly. That includes things like Quick Rates when you need to check the 10T as you walk into a meeting or a shortcut cap pricer under “Caps” when you’re having lunch and a client asks how much a $35mm cap at 3% for 36 months would cost.
Last Week This Morning
- The 10T steadily grinded higher all week to 2.86%
- German bund unchanged at 0.34%
- 2 year Treasury unchanged at 2.63%
- LIBOR at 2.11%
- LIBOR started climbing and will continue to do so as we approach the Sept 26th FOMC meeting where the market has a 95% probability of a hike priced in
- SOFR at 1.93%
- GDP came in at 4.2%, the fastest in four years
- Trump announced plans to sign a bilateral agreement with Mexico and Canada can come to the table if it wants.
- Core PCE hit 2.0% again, the third time this year
- Italian government bonds spiked, with the 10yr hitting 3.24%, the highest yield since 2014.
- Argentina hiked its benchmark interest rate to 60% to fight inflation (about 30% and climbing) and support the peso.
- Trepp released a report highlighting the spread between AAA and BBB- CMBS paper hit its lowest level since May 2007. Before you run for the hills, take note that the spread is now 2.10% while a decade ago it was 0.67%.
- Former Michigan WR Braylon Edwards said of the current team, “Michigan offense so predictable…Michigan football is sadly one thing…Trash.”
- Finally, something I can agree with a Michigan fan on
Complacency Trap
On September 1, 2007 I set out for a Charlotte bar in search of the Penn State vs Florida International game. Not exactly a barn burner, but my kids were too young to take up all my time on the weekends so I still found ways to catch inconvenient games. I found myself at Angry Ales, which I soon discovered was the home bar for the App State alumni association. I remember thinking, “Who would go out to a bar to watch their team get drop kicked by #5 Michigan?” App State ultimately blocked the game winning FG attempt by Michigan and the place erupted, creating one of the most memorable sports experiences of my life for a team I had no vested interest in. Michigan had underestimated the Mountaineers, who had an entire offseason to prep for just one game.
Fast forward exactly 11 years, and PSU nearly fell into the same complacency trap. Trace McSorley may never play a down in the NFL, but he’s becoming a Happy Valley legend. But make no mistake about it, PSU was plain ole lucky to escape with a W. Not the start to the season I had hoped for.
I can’t help but wonder if the market is falling into the same sort of complacency trap. Last week we had trade dispute chatter, $200B tariffs, NAFTA negotiation breakdowns, currency crisis in Argentina, Italian debt yields spiking, really strong GDP and benchmark-hitting inflation data…and rates didn’t budge.
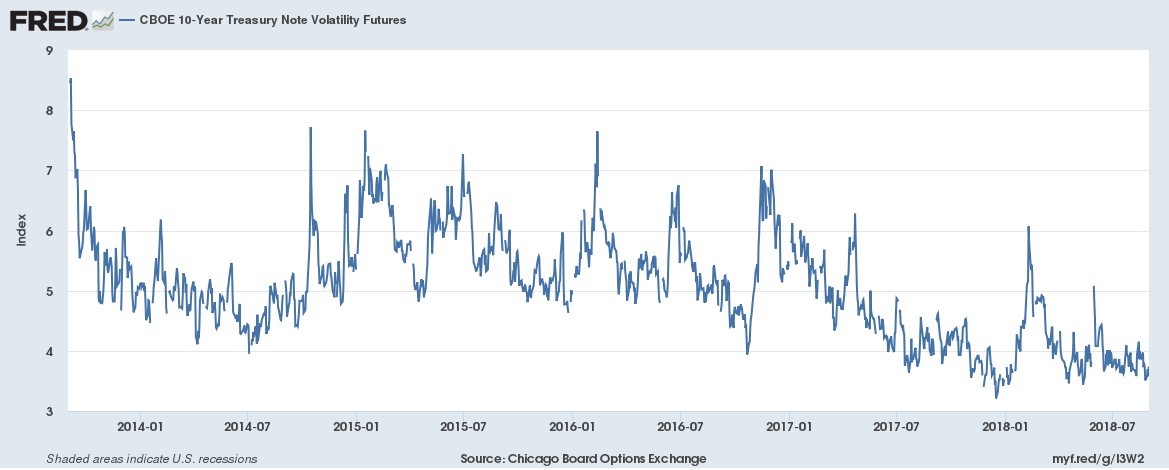
Here’s a graph illustrating volatility in the 10 year Treasury market. Not-quite-but-almost-touching-all-time-lows. Volatility has been artificially depressed with a neutral Fed and massive QE…but now the Fed is hiking and reducing its balance sheet.
Bloomberg put together an interesting chart that tries to capture speculative risk sentiment in futures markets by summing net speculative exposure in traditional flight to safety plays. It’s so simple even a state school kid like me can follow. Net positions of:
10 Year Treasury + VIX + Gold = This Graph
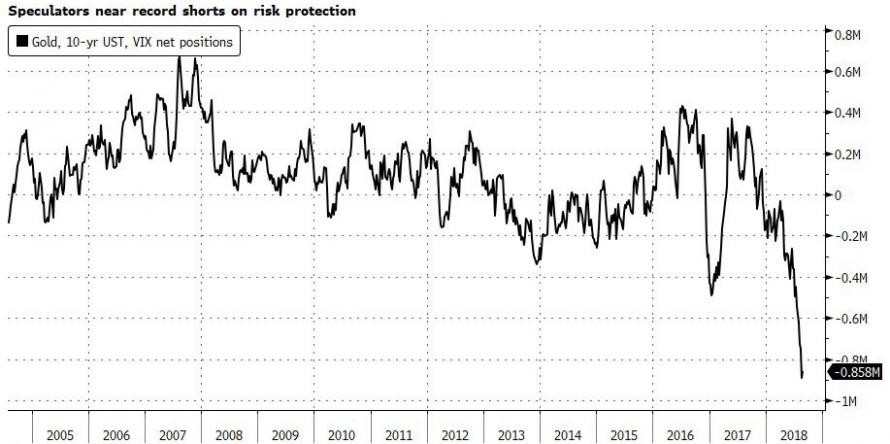
Bloomberg’s Michael Regan, “the obvious takeaway is that positioning is all on one side of the boat and speculators are woefully unprepared for a major risk-off event, suggesting complacency may be reaching epidemic levels as equities break out to new highs.”
Trade disputes alone would seem to dramatically increase the variance of outcomes in Treasury yields, yet the market is treating it like a season opener against a little known school in Boone, NC. In any other year, that sort of noise would send investors scrambling for safety. Today? A non-issue apparently.
GDP Probably Just Peaked
GDP came in at a four year high, undoubtedly aided by the tax cuts, deregulation, and the pro-business psychology of the Trump administration. But going forward those are likely to be offset by trade war fears (right up until the savior swoops in to bail us out of the self-created crisis), the fading impact from fiscal policies, and less Fed accommodation (higher rates and balance sheet normalization). Consensus economic forecasts suggest the same. Here’s the average forecasts from the Bloomberg survey of over 60 economists.
2018 2.9%
2019 2.5%
2020 1.9%
You would be forgiven for mistaking those for the odds the Texas Longhorns will win the Big 12 over the next three years…
I had a boss that used to joke, “If economists were better at their jobs, they’d be traders”, so take these forecasts with a grain of salt. But calling for higher GDP going forward will be going against the grain.
This slowdown could come in the face of rising inflation (let’s not call it stagflation, which requires high inflation and high unemployment, neither of which we are close to right now). The Fed may have to keep hiking interest rates to ensure Core PCE doesn’t exceed 2.3%-ish even as GDP is declining. Remember, the Fed is now using the word “symmetric” to describe its approach to managing inflation expectations, so a reasonable overshot will be tolerated.
Over the next 6-9 months, the Fed may become data-dependent again, and perhaps even a bit nimble, as it adapts to incoming information.
With the Fed approaching its new neutral of 2.50%-ish, each incremental hike will require that much more evidence to support it. If GDP does decline, the Fed will likely need to slow the pace of hikes or at least talk up the possibility that the tightening cycle is coming to an end.
This Week
Quite a bit of data in the holiday-shortened week, primarily manufacturing data and durable goods. Also, a lot of Fed-speakers slated throughout the week.
Most importantly, the Super Bowl champion Eagles will kick off the season on Thursday night against the hapless Falcons. Hopefully Arthur Blank roams the sidelines.
Way Too Early Super Bowl Prediction for this year…
Philadelphia Eagles 36
Bama Crimson Tide 35