

Last Week This Morning
- 10 Year Treasury ran up to 1.73% early in the week, before retracing just as quickly and closing at 1.53%
- German bund mostly unchanged at -0.59%
- Japan 10yr unch at -0.20%
- 2 Year Treasury closed at 1.40%
- LIBOR at 1.98%
- SOFR set on Friday at 1.84%, but had spiked to 2.35% on Monday since it was the last day of the quarter
- The economy added 136k jobs last month, slightly below expectations
- The unemployment rate fell to 3.5%, a 50-year low
- Manufacturing had its worst month in a decade
- Manhattan apartments fell the most since ‘11 and now average a much more affordable $1.7mm
- Australia cut rates for the third time this year, pushing its benchmark to 0.75%
- Air cargo rates fell to a four-year low
- Good luck to those five FOMC members that are forecasting a hike before year end
- It’s so hot I can’t tell if the leaves are changing colors for fall or if they are just dying
Jobs Report
Friday’s job report fell into the goldilocks scenario where it was low enough to suggest another rate cut, but not so weak as to scream “recession”!
The Non-Farm Payroll (NFP) report showed that economy added 136k jobs last month, which is actually the fifth lowest print in the last three years. Last month’s report was revised up by 38k. The unemployment rate dropped to 3.5%, a 50-year low.
The most disappointing aspect of the report was the miss on average hourly earnings. This is considered an inflationary indicator and came in at 2.9% vs 3.2% forecast, a 15-month low. This data point, more than the 136k NFP, gives the Fed an excuse to cut rates. With the threat of inflation fading, it can be more accommodative.
The market responded by pricing in a 73% probability of a rate cut at the October 30th FOMC meeting. There’s a 91% probability of at least one cut before year end. This week’s minutes from the last FOMC meeting may help shed some light on whether those 5 members calling for a rate hike actually believed it or were just throwing a temper tantrum in opposition to the cut.
NFP is an incredibly significant number that reveals a lot about the health of the economy. It does a great job of confirming a true recession, but doesn’t do a great job as a predictive measure. If we look at the last three recessions, NFP is usually positive right up until the recession. It tends to trend lower, occasionally even dipping into negative territory, before turning sharply negative once the recession officially begins.
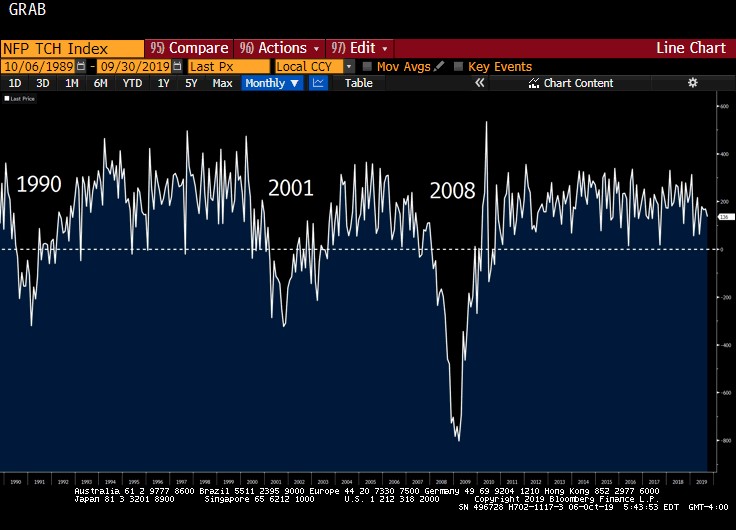
The current averages suggest we are in good shape, but keep an eye on this in 2020. If NFP grinds lower, it could be a signal of a deeper slowdown.
Today
6 month average: 154k
3 month average: 156k
Here’s a timeline (left to right) of NFP heading into and immediately after a recession.
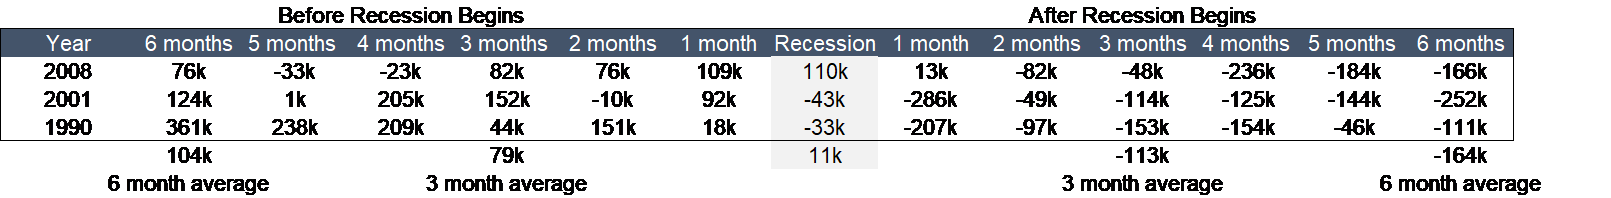
If the economy keeps adding 100k+ jobs, we can probably avoid a recession. But if we see reports moving lower and lower, it probably means we are headed for a recession and the prints will suddenly start showing monthly losses.
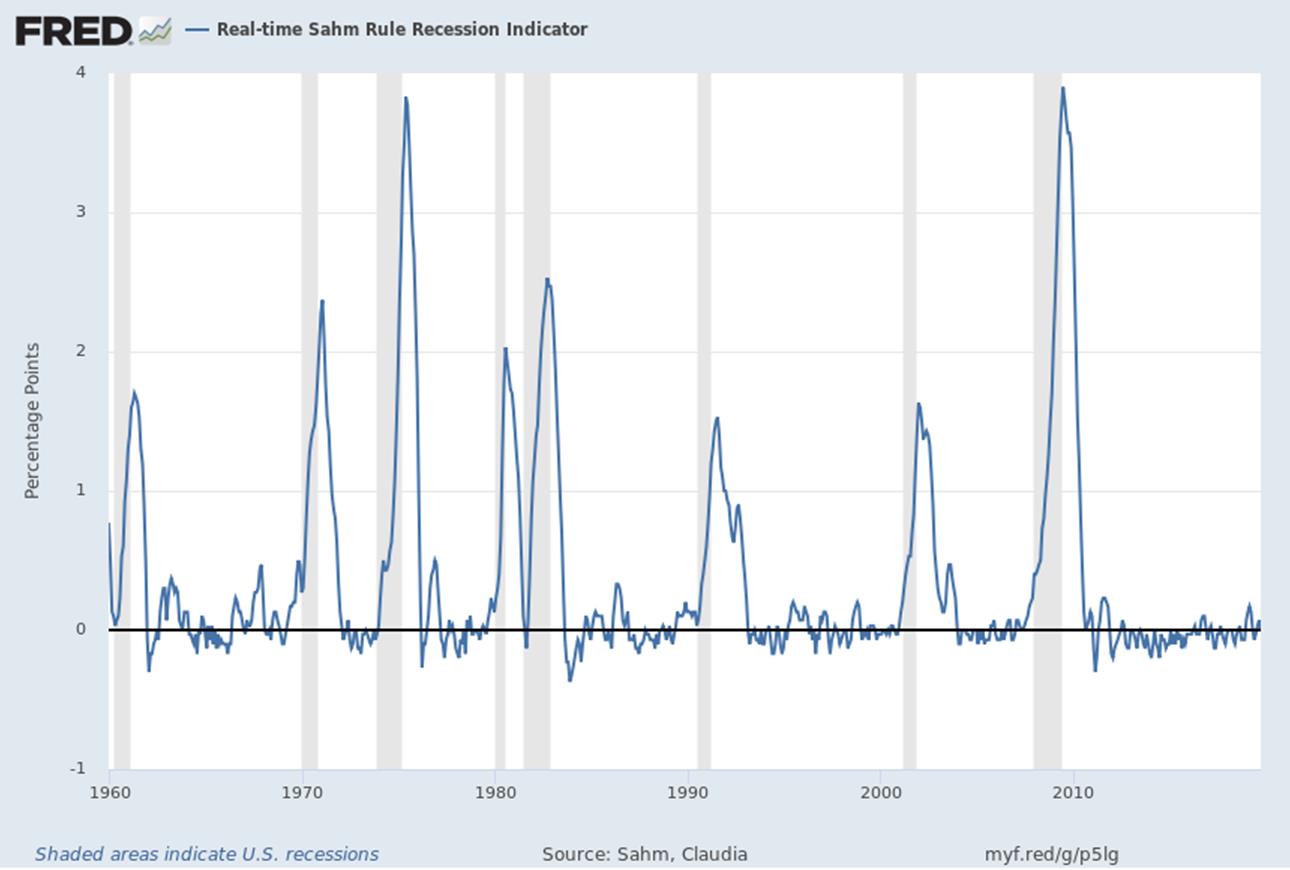
Even the Fed has gotten in on the UR action, releasing a new index created by Dr. Claudia Sahm, a Fed economist with a PhD from Univ of Michigan back when they had still had admission standards.
The St. Louis FRED site with all the coolest graphs includes this as the “Real Time Sahm Rule Recession Indicator.”
“Sahm Recession Indicator signals the start of a recession when the three-month moving average of the national unemployment rate (U3) rises by 0.50 percentage points or more relative to its low during the previous 12 months.”
The good news is that it is not signaling any recession warnings right now. But we will be keeping an eye on this index in the coming months to see if that changes.
Repo
For the CNBC talking heads that said the recent repo illiquidity is a big nothingburger, here’s the NY Fed’s statement on Friday announcing continued emergency repo measures through early November.
In accordance with the most recent Federal Open Market Committee (FOMC) directive, the Open Market Trading Desk (the Desk) at the Federal Reserve Bank of New York will conduct a series of overnight and term repurchase agreement (repo) operations to help maintain the federal funds rate within the target range.
Effective the week of October 7, the Desk will offer term repos through the end of October as indicated in the schedule below. The Desk will continue to offer daily overnight repos for an aggregate amount of at least $75 billion each through Monday, November 4, 2019
Just so I’m clear, are corporate tax payments and Treasury auction settlements still to blame?
That overly-simplistic explanation makes for an easier discussion, but reality is far more complex. The real explanation is complicated, nuanced, and largely unknown. Here are some of the reasons we are hearing from traders:
- Treasury supply to fund the expanding deficit (primary dealers are legally obligated to buy Treasurys at each auction)
- Decline in bank reserves during balance sheet normalization
- Increased regulation on banks, such as Liquidity Coverage Ratios and Basel 3
Meanwhile, the Fed’s balance sheet has started to grow again and yet no one is calling it QE4…
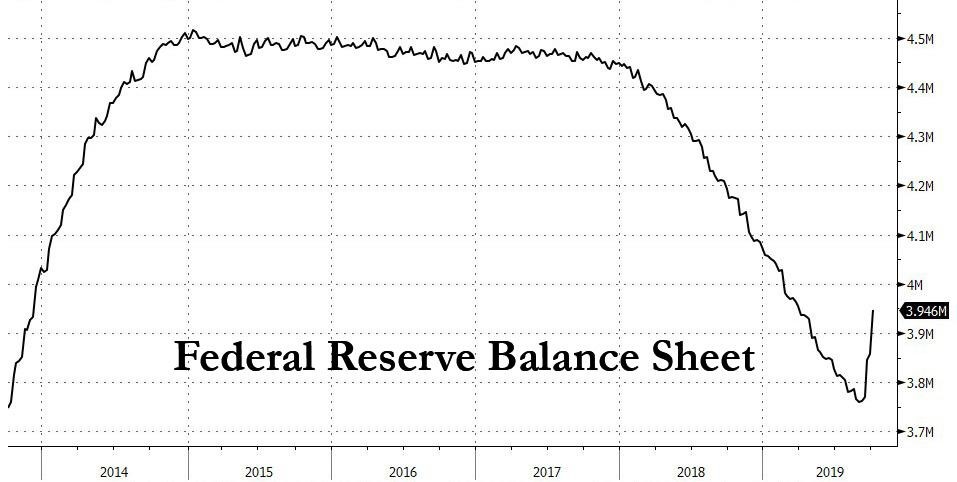
There is a growing likelihood that the Fed announces additional liquidity measures at 10/30 FOMC meeting. The printing presses are about to be turned back on again.
Is anyone else worried that we are poised to announce QE4 emergency measures while unemployment is 3.5%? Will we ever be able to unwind this massive accommodation? Will QE4 really become QE4ever?
Rates
Sometimes I wonder if readers only check out the newsletter title. On September 9th, I wrote a newsletter entitled, “A 1.00% 10 Year Treasury?” The 10T promptly ran up to 1.898%. I got a lot of emails that week.
Never mind that the title was really a question, not a prediction. Or that I wrote, “All else being equal, this suggests the 10T could rebound from current levels, maybe as high as 1.85%. But a break above 2.00% feels unlikely in the near term.” It went to 1.898%, not 1.85%. Mea culpa…
I concluded with, “But if the global economy slows, inflation falls, and the economy contracts, can we really rule out a 1.0% 10T over the next year?”
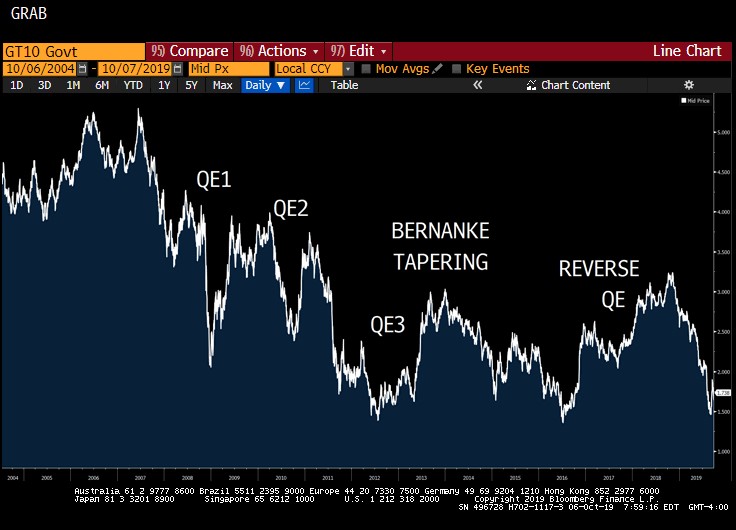
I still think a 1.00% 10 Year Treasury yield is a distinct possibility. While not the most likely outcome, I still wonder if we can really rule it out? Here’s the 10 Year Treasury yield over the last 15 years, highlighting the different rounds of QE, as well as reverse-QE measures like Bernanke’s infamous Taper Tantrum statement as well as the formal balance sheet normalization announcement in September 2017.
When the market expects QE, rates go down. When the market expects reverse-QE, they go up. If the Fed effectively announces QE4 in three weeks, it seems possible that the 10T breaks through 1.36% at some point over the next three months.
Now, that’s a longer-term horizon and assumes the economy continues to slow.
Based on data right now, last week’s movement was probably overdone. I wouldn’t be surprised to see the 10T rebound this week.
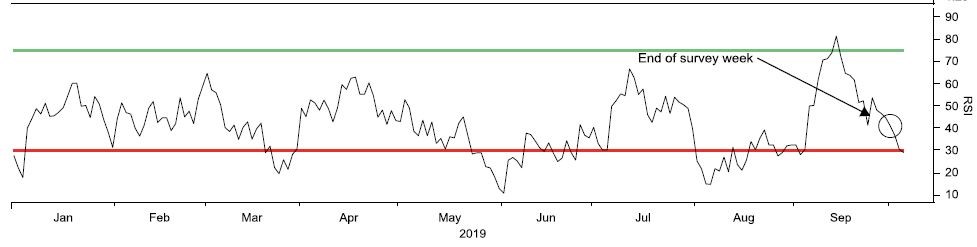
Here’s that BNP Paribas RSI on the T10 I like so much. It suggests the 20bps drop last week was too much and the 10T is in overbought territory. If the 10T moves back more into the middle of the range (neutral position), that would put it around 1.65%.
This Week
FOMC Minutes and inflationary data will be the headliner movements, but all eyes will really be on the next round of China negotiations that are supposed to take place Thursday and Friday.