

Last Week This Morning
- 10 Year Treasury up a few bps to 0.75%
- German bund down 7bps to -0.62%
- 2 Year Treasury closed at 0.14%
- LIBOR at 0.15%
- SOFR is 0.10%
- Core CPI came in as forecasted, 1.7%
- Core PPI came in higher than forecasted, 1.2%
- University of Michigan forward inflation expectations suggest 2.7% in a year
- Initial jobless claims were nearly 900k, higher than forecasted 825k
- Retail sales came in much stronger than expected
- Budget deficit exceeded $3T
- Only Tampa would be on the verge of having the best sports year ever in a year that no one cares
2016 Election Refresher – Volatility, Rates, and Caps
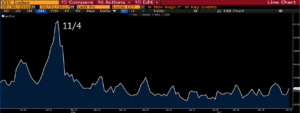
The election was held on November 8th, but vol spiked ahead of the election, peaking on the preceding Friday. This is especially critical for anyone buying a cap over the next few weeks. I would not be surprised to see cap prices climb strictly as a result of vol spiking. Plan accordingly.
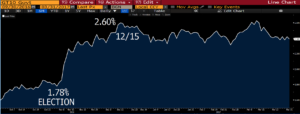
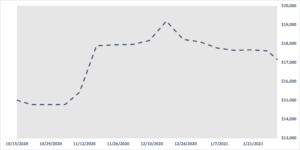
Remember when the 10T spiked 0.20% the day after the election? Or ran up 0.80% over the following month?
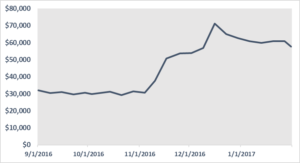
Or how cap prices doubled?
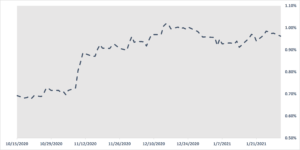
A similar move in the 10T this year might look like this.
Same for caps – $10mm 3yr 1.50% strike on LIBOR (SOFR – add $15k-$20k).
2020 Election Impact on Markets
Firstly, let’s agree that I have no clue. In 2016, I thought the 10T would move below 1.50% if Trump won (I mean, technically I was right, I just needed a few years…).
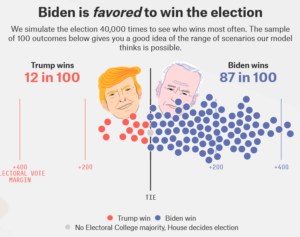
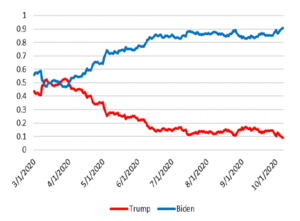
Before we dig into the impact, let’s talk about probabilities. Trump’s odds have tanked since the start of September. Here’s how FiveThirtyEight’s probabilities currently shake out.
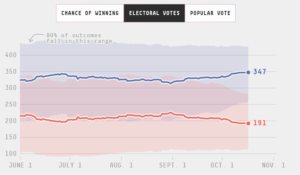
Here are projections for Electoral College votes. Remember, they need 270 to win.
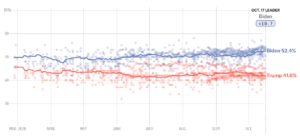
FiveThirtyEight also does a good job of aggregating polling data. Right now, Biden has a 10.7% lead nationwide.
It isn’t just FiveThirtyEight. Here’s the Economist’s forecast.
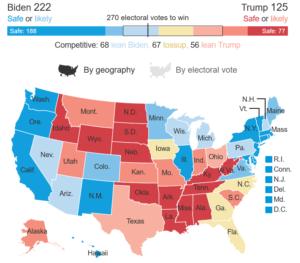
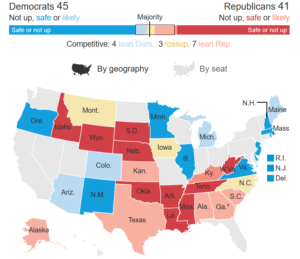
Even the WSJ suggests an uphill climb for Trump. They don’t make outright forecasts, but instead focus on Electoral College probabilities. Biden has 222 “safe or likely” votes, while Trump has just 125.
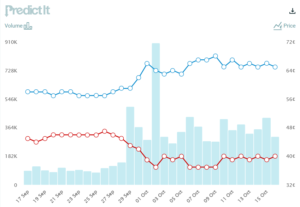
Betting odds have changed, too. PredictIt’s odds have changed dramatically in the last month, although not quite as much as forecasting models. Maybe putting your money where your mouth is keeps a lid on the odds.
It’s not just the Oval Office, either. The Senate is in play and actually favors the Dems taking control. This seemed unthinkable two years ago.
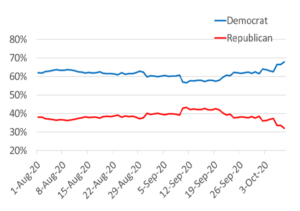
The WSJ disagrees, suggesting a slight GOP lean will more likely conclude with a Republican Senate majority.
Any way you slice it, the Republican party has a challenging election ahead.
This is where the Trump supporters email reminding me how wrong the polls were in 2016. Heck, Irish bookmaker Paddy Power actually paid out some Clinton wagers before the election, ultimately costing them $1mm.
Yes, the polls were wrong in 2016. But not by as much as we probably remember they were…
If We Are to Believe This Year’s Polls, Let’s Review 2016
Punchline first: The 2016 forecasts were pretty average by historical standards.1
In fact, FiveThirtyEight published an article three days before the election entitled, “Trump is Just a Normal Polling Error Behind Clinton.” 2 But no one remembers that.
If Trump was within the normal polling error of winning, why were so many (none more so than me) caught off guard by a Trump victory?
My thoughts:
- Trump was a unique candidate running against an extremely traditional candidate, which skewed interpretation of his chances.
- How the media portrayed the forecasts was more wrong than the actual polls themselves
- It also became convenient for the media to blame polling errors than their own coverage
- The Hill blamed data3
- The NY Times, perhaps the news organization that most overestimated a Clinton victory, published an article a week after the election not blaming themselves, but the polls4
- Comey Effect – Clinton’s nationwide polling lead shrank from 5.7% to 2.9% in the week after Comey sent a letter to Congress he was reviewing additional Clinton emails. Clinton’s odds of winning also dropped, from 81% to 65%.
- Overconfidence in data. FiveThirtyEight gave Trump a 30% chance to win the Electoral College on the eve of the election. Would I buy a lottery ticket that had a 30% chance of paying out? But a 30% chance of a Trump victory was being treated like it was 0%.
- The margin of error, which was pretty typical by historical standards, had an outsized effect because of Trump’s strength in the Electoral College. Trump’s 2016 victory was the largest popular vote vs electoral college gap since 1876. His win largely came down to 78k votes across three states – PA/Wisconsin/Michigan.
- It also became convenient for the media to blame polling errors than their own coverage
While the forecasts incorrectly predicted a Clinton victory, they probably weren’t as wrong as we remember them to be.
With that in mind, let’s talk a little about what impact the election could have on interest rates. Note that the resulting 10T assumes all else being equal. For example, if a vaccine emerges, rates could jump regardless of who wins.
Base Case Scenario – Blue Wave
Prior to the Comey statement, Trump was trailing Clinton by 5.7% and he still won, right? These projections are all bogus and Trump will prove it again. Take your forecasts and go home.
But Biden is currently ahead by 10.7%. He has a lot of cushion. I can hear Dems screaming, “don’t jinx us!”
Big picture, Trump’s Electoral College advantage roughly translates into a 3% gap in the popular vote, meaning Biden needs to win by approximately 3% to win the Electoral college. Remember that Clinton’s lead shrank to 2.9% in the week ahead of the election – just inside that rule of thumb.
Another good rule of thumb – the typical polling margin of error is 3.0%. That means maybe Biden’s lead is only 7.7%. But even with this adjustment, Biden’s lead is substantially larger than Clinton’s lead. Cushion.
Trump will almost certainly lose the popular vote again, but like 2016 could still win because of the Electoral College. Those odds, however, are far lower than they were in 2016. Here’s how states most likely to determine the 2020 winner compare to 2016.

Trump won the Electoral College 304-227. Even allowing for margin of error, Clinton would have won all three of those states had she had a lead similar to Biden’s.
PA/WI/MI cast over 13mm votes and Trump won them by a combined 78k – that’s just 0.59%. Yes, lightning could strike twice. But I would be careful of leaning too heavily on 2016 as precedent. Trump is in very real trouble of losing. He needs to close that gap and hope there’s a similar margin of error as we saw in 2016. Or maybe that Comey will send another letter to the House Judiciary Committee.
Despite all the evidence to the contrary, I still find it hard to believe that a blue wave is the most likely outcome because I am having a tough time envisioning that the Senate will flip. FiveThirtyEight puts this scenario at 68%…eerily similar to the odds they gave Clinton winning in 2016. But let’s admit 68% is greater than 50% and move on…
- Large stimulus package is approved, generally positive for markets and causes upward pressure on rates.
- Reversal of Trump-era Tax Cuts and Jobs Acts, likely a negative for stocks
- Greater regulation, also a negative for stocks
- Volatility likely moves up as the market tries to digest the various outcomes as well as a potential legal challenge to the election results
Near Term Outcome: 10T climbs toward 1.00%, maybe even establishing a new range of 1.00% – 1.25%.
Biden Victory, but GOP Retains the Senate
This would be my personal base case if not for the data telling me otherwise.
- Muted response while markets try to figure out if a split Congress can play nice with each other
- Any progress on fiscal policy is smaller than in the blue wave scenario
- Legislation is increasingly fought over in court
Near Term Outcome: 10T flat, perhaps even down slightly with market disappointment over lack of stimulus
Trump Victory, Dems Take the Senate
In an odd way, this could result in the biggest stimulus package. Trump has already said he wants even more money for stimulus than the Dems have proposed, but I suspect McConnell is being a thorn in his side behind closed doors.
Near Term Outcome: probably muted, but there’s a scenario where the 10T moves to 1.25% – 1.50%
Trump Victory, GOP Retains the Senate
Gridlock.
Near Term Outcome: 10T flat until market figures out if Congress will play nice again
What if Trump Loses But Disputes Outcome?
If I’ve said it once, I’ve said it a thousand times – markets hate uncertainty. Rates down and stocks flat or down.
This scenario feels dependent on how close the outcome is – if Biden wins PA/WI/MI by 78k votes, establishment Republicans may allow Trump to cry foul. If he loses them by a wide margin, however, they may be less inclined to humor him.
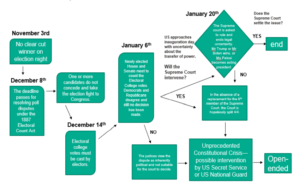
If you want to dig into the logistics of a challenged election, BNP Paribas put this helpful graphic together based on an article run by the Financial Times5
Week Ahead
Very quiet week on the data front. Plus, who needs economic data when we have a pandemic and presidential election to keep us busy.
Biggest near-term driver of rates continues to be any news on stimulus.
Sources
- https://fivethirtyeight.com/features/the-real-story-of-2016/
- https://fivethirtyeight.com/features/trump-is-just-a-normal-polling-error-behind-clinton/
- https://thehill.com/hilltv/what-americas-thinking/394665-pollster-we-didnt-get-it-wrong-in-2016-it-was-data-sites-like
- https://www.nytimes.com/2016/11/10/technology/the-data-said-clinton-would-win-why-you-shouldnt-have-believed-it.html
- https://www.ft.com/content/c8767e22-a727-4a23-90bf-8d2844ca257a