

10 Year Treasury Yield at 3.23%
The 10yr Treasury has spiked and sits at 3.23% as of this writing. It is the biggest single day move since the 2016 election.
Pundits are pointing to a variety of catalysts, none of which we believe are enough alone to create this kind of movement. Commonly cited reasons thus far:
- Powell’s upbeat comments last night that the economic expansion can continue indefinitely
- He also indicated that rates might rise above neutral
- Yesterday’s stronger than expected ADP results
- Near-record print in manufacturing data
- Escalating tensions with China
- Global withdrawal of accommodation
- 30 year Treasurys broke 3.25%
The move caught traders off guard. Powell has been consistently hawkish – why were last night’s comments suddenly so shocking? The Fed has been telling us all year that it expects to hike beyond neutral – how is this a revelation? Payrolls have been consistently strong – why now? Central banks have been withdrawing accommodation for years – this is not breaking news.
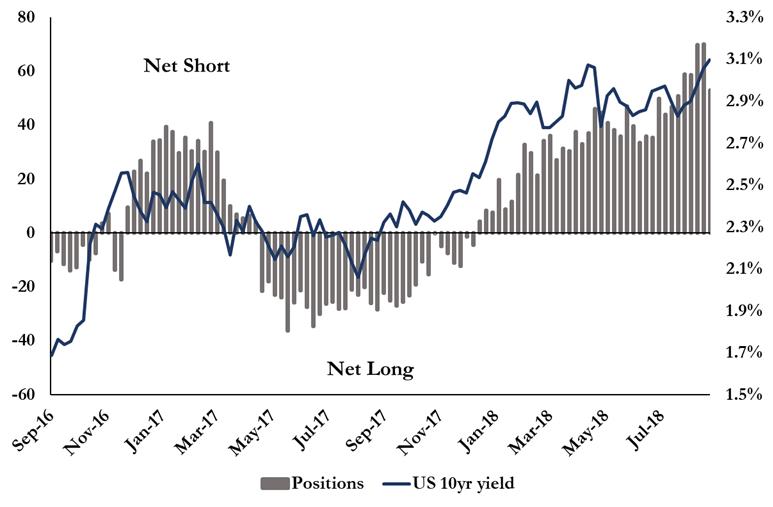
We suspect Powell’s comments were really just the straw that broke the technical camel’s back. We’ve been highlighting the risk of higher rates in this newsletter for months as market sentiment just kept building. Perhaps those chickens finally came home to roost. Here’s that graph on record net shorts.
Next Stop?
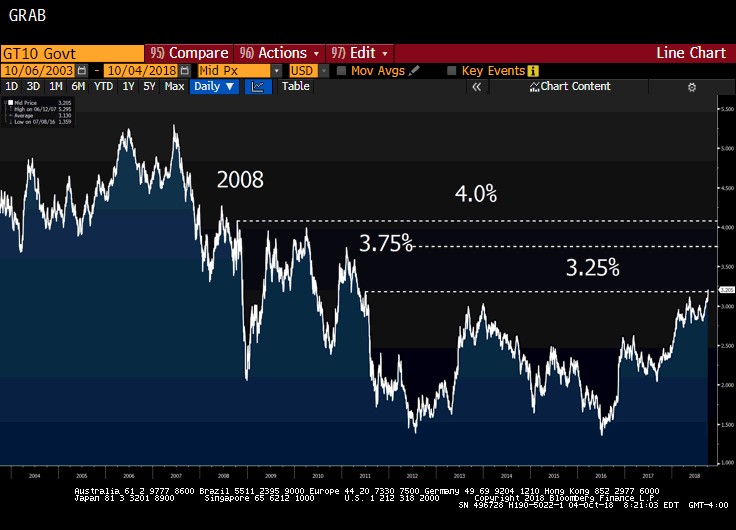
Take note in the graph below that 3.50% is not necessarily a key technical level. In general, if the 10T gets to 3.50%, it also gets to 3.75%.
That does not mean if the 10T breaks 3.25% we are off to the races to 3.75%…but it is certainly a risk.
Also note that the last time the 10T broke 3.25% it took…
- 5 days to reach 3.50%
- 45 days to reach 3.75%
Bottom Lines
- We would expect the 10yr Treasury to encounter significant resistance at 3.25%.
- At least some of those record shorts will cover and take their profits.
- Two weeks ago we suggested the shorts would not cover at 3.05% because they wanted to see if they could ride the wave to 3.25%. We suspect more will cover here.
- We would not be surprised to see some retracing as the dust settles from the initial panic move, but it is likely that 3.25% is the new top end of the range.
- But…if…if…if…3.25% is broken, do not assume 3.50% is the next stopping point.
- Somewhere between 3.50%-3.75% is the next significant resistance level.
Cap Pricing
Front end rates are up as well, with the 2 year Treasury up 0.06% to 2.87%. That move, coupled with increased volatility, will be bad for cap pricing in the near term.