

What a crazy week last week. We basically had a year’s worth of headlines in 5 days.
Last Week This Morning
- 10 Year Treasury hit 2.29%, the lowest yield since Oct ’17, before closing the week at 2.32%
- 10T dipped below Fed Funds for the first time since the financial crisis
- German bund at -0.12%
- Japan 10yr at -0.07%
- Stocks seem blissfully ignorant
- 2 Year Treasury closed at 2.16%
- LIBOR at 2.42% and SOFR at 2.37%
- At one point last week, the market had a 90% probability of a rate cut by year end
- Current odds are 78%
- JPM cut Q2 GDP forecast from 2.2% to 1.0%
- British PM May resigned
- Boris Johnson is the odds-on favorite to replace her in betting markets
- Oil had its worst week of the year, down 6%
- Tensions with Iran are escalating and yes this could be a thing
No Deal Brexit
British Prime Minister Theresa May resigned on Friday, greatly reducing the odds of some type of negotiated Brexit. If anything, the outcome is more binary – No Deal Brexit vs Remain.
The “new” deadline for an agreement is 10/31 and the EU has indicated there will be no more extensions. This is particularly true if Boris Johnson becomes the next PM. He is universally despised by the leaders of the EU and they will be unlikely to make any concessions for him that they wouldn’t make for May.
Like so many other things on this morning’s list, No Deal Brexit is an event risk the market can’t really quantify. Therefore, it is scary and the market doesn’t like the possibility of it.
Boris Johnson as PM may be the best thing that ever happened to Theresa May’s popularity.
Debt Ceiling
It’s been easy to forget given all the other headlines, but the Treasury has been relying on “extraordinary measures” to pay its obligations since the debt ceiling suspension ended March 1. It should run out of cash on hand sometime in the fall, likely late October or early November.
I can’t believe the 35-day long government shut down ended just four months ago. And now we’re looking ahead to the possibility of another one at year end. Pelosi will probably try to bait Trump into shutting the government down over border wall funding.
Oil
Oil had its worst week of the year and is back below $70/barrel on fears that the trade dispute between the US and China will serve as a drag on demand. OPEC’s been restricting supply this year to help prop up prices, but on Wednesday the Energy and Information Administration (EIA) reported a surprise increase in inventory and decrease in demand. Not a good combo for oil prices.
OPEC will likely continue to restrict supply through the remainder of 2019, so pricing softness could be…wait for it…hang on…Jay Powell would be proud…almost there…transitory!
Or maybe oil is headed for $40/barrel.
Inflation
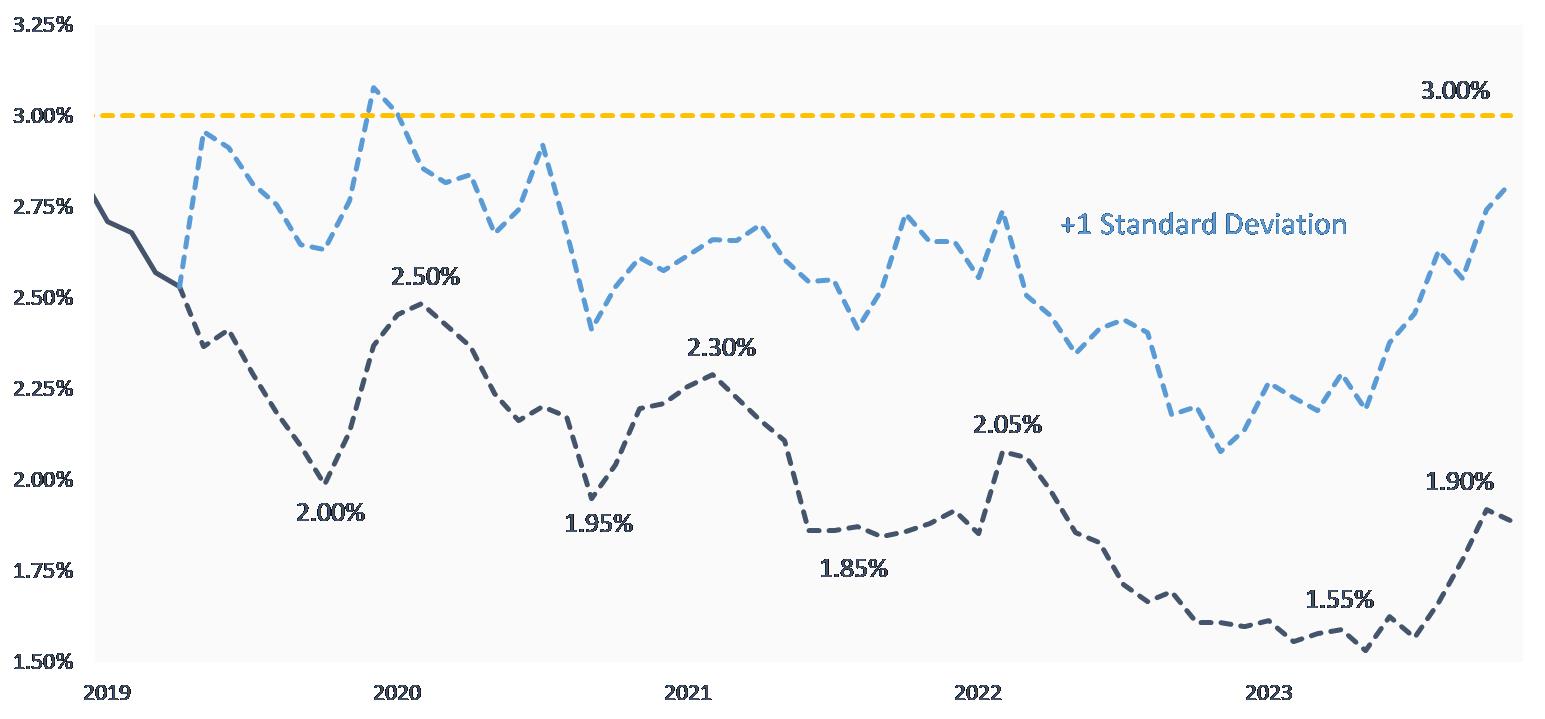
Inflation is one of those tricky self-fulfilling-prophecy-data-points. If you believe something will cost more in the future, you buy now. That, in turn, drives up the price…and now your expectations have become reality.
That’s why economists like to track forward-looking inflation expectations. Notice how sharply those have fallen over the last twelve months, just as the Fed’s preferred inflation measure, Core PCE, has also fallen.
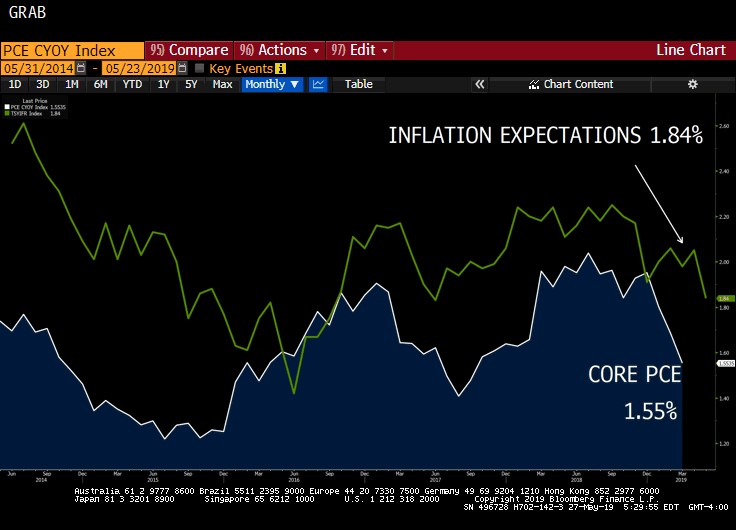
While the Fed has been consistent with its messaging about inflation returning to 2%, cracks are starting to show.
In the minutes from the May 1 meeting released last week, the Fed has changed its groupthink and now sees inflation falling short of 2% “over the medium term.” This is a startling 180 from the previous meeting where Powell described inflation softness as “transitory.”
Just as importantly, it is still calling for the Unemployment Rate to decline. Another nail in the Phillips Curve coffin.
Furthermore, some “expressed concerns that long-term inflation expectations could be below levels consistent with the Committee’s 2% target or at risk of falling below that level.”
Additionally, several saw a danger that expectations would become anchored at sub-2% levels “if inflation did not show signs of moving up over coming quarters.’’
So much for transitory softness in inflation.
Recession Probability
The Fed’s own recession indicator has jumped recently, hitting the highest point in more than 5 years.
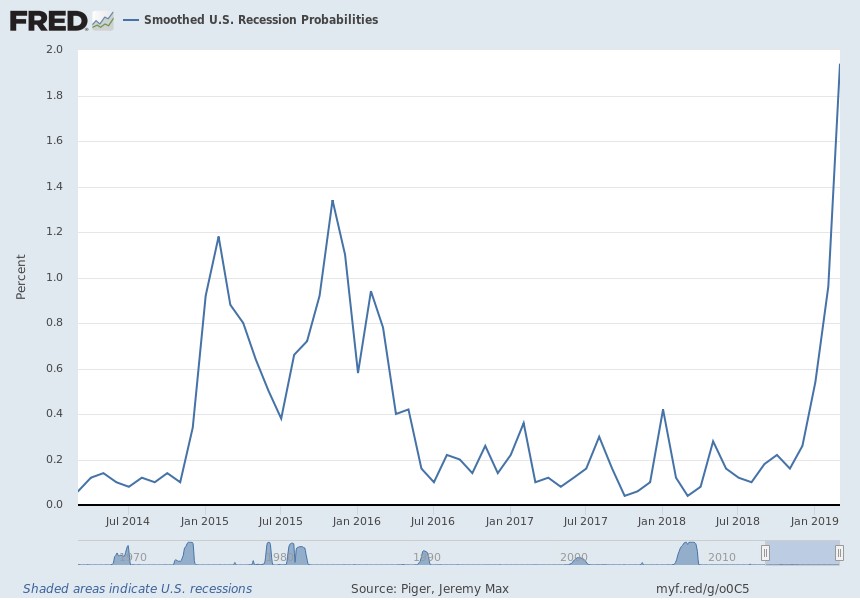
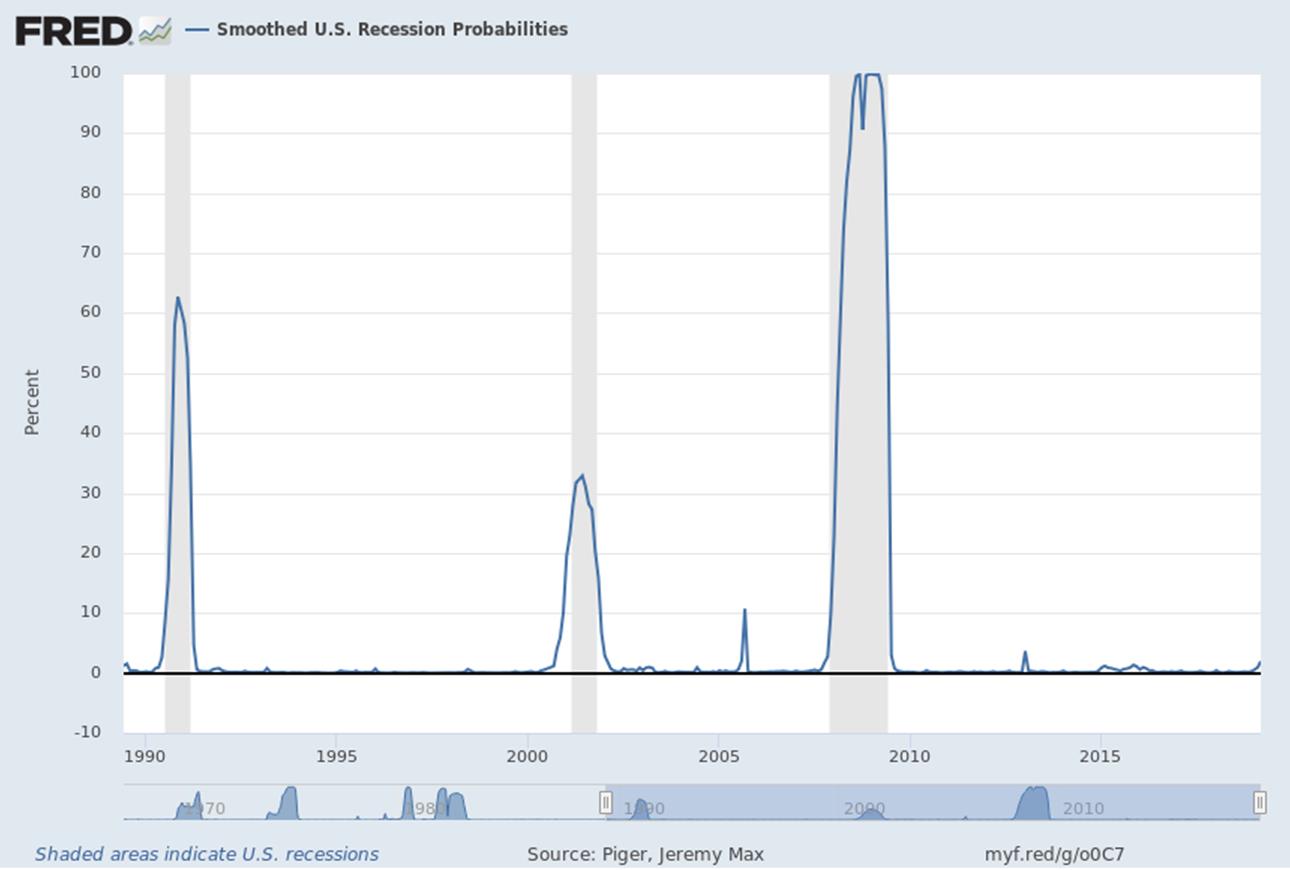
But before we all freak out, keep in mind it is still very low in the grand scheme of things (see 30 year graph below). The index, currently at 2%, typically needs to exceed 20% to have a great batting average at predicting recessions. But also note that it tends to spike very quickly, meaning that a 2% reading this month could be a 20% reading by the summer. We will be keeping a close eye on this index.
Rates
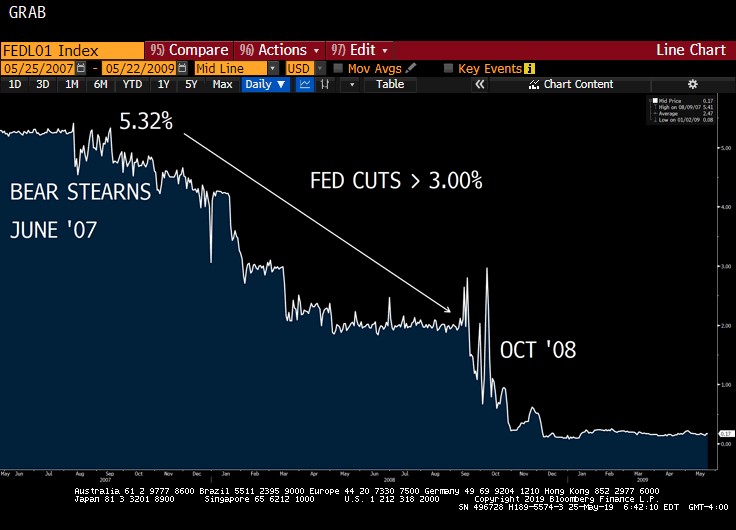
The 10 Year Treasury dipped below Fed Funds for the first time since 2007. Here’s a graph showing the spread between the two since the financial crisis. Notice how the spread went negative before the actual crisis.
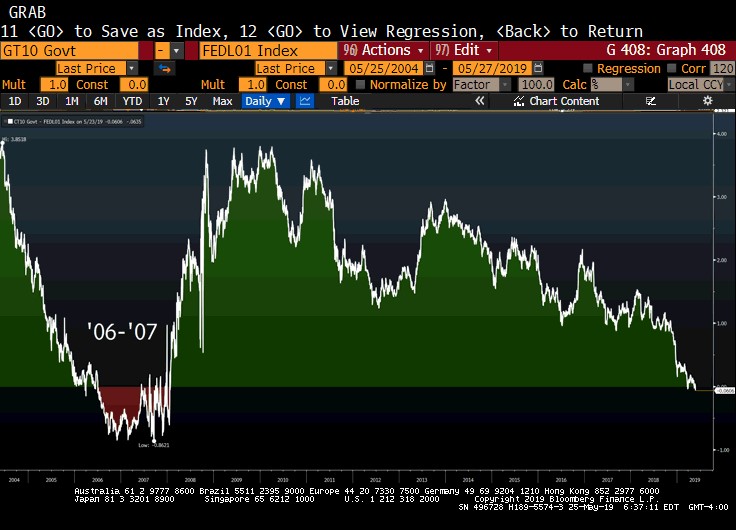
Part of the reason the relationship flipped positive before 2008 was because the Fed started cutting rates aggressively in 2007. In fact, the Fed had cut rates by more than 3% by the time most of us remember banks going under in October 2008.
Although the Fed hasn’t officially started cutting yet, the market is pricing in two rate cuts over the next twelve months. That alone is preventing an inverted curve right now.
So what typically happens to the 10 Year Treasury yield after the Fed stops hiking? It moves lower. Frequently, it moves lower for a year, rebounds once the Fed starts cutting, and then resumes its downward march. Here’s the T10 after the last five tightening cycles.
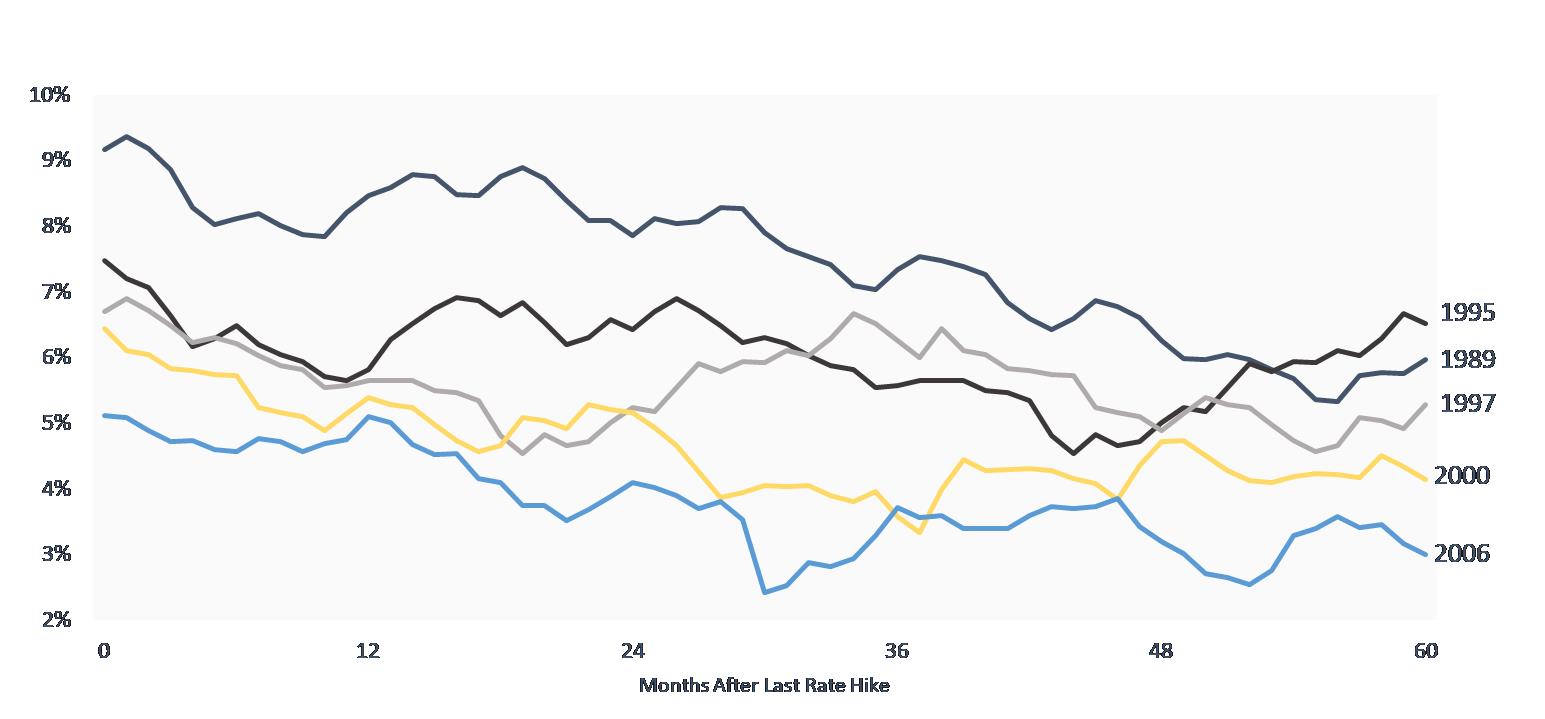
What would that mean for the current 10 Year Treasury? Even if we shock the average outcome, we still find that 3.0% is the ceiling on the 10T over the next five years.
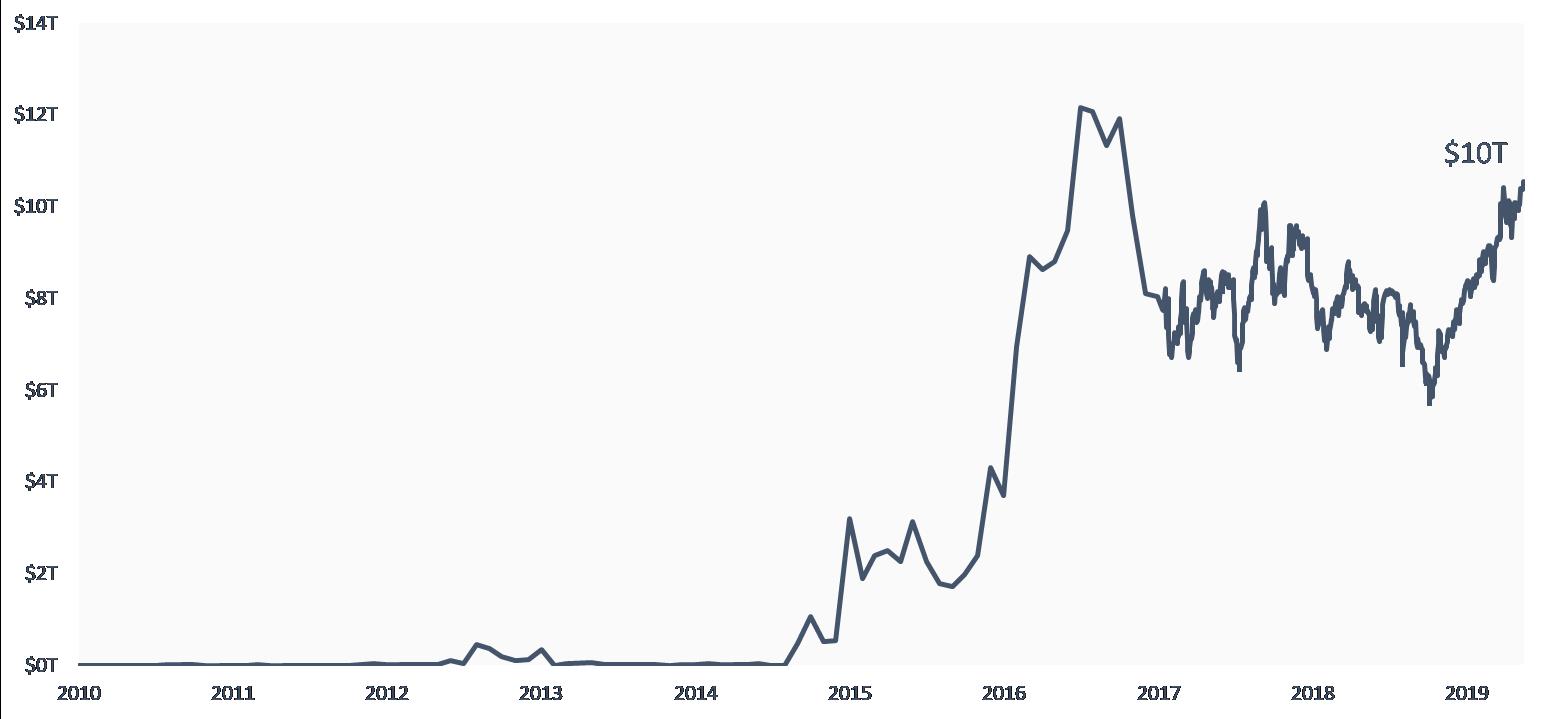
And with negative-yielding global debt back over $10T (yes, with a T), what exactly would be the catalyst for higher yields?
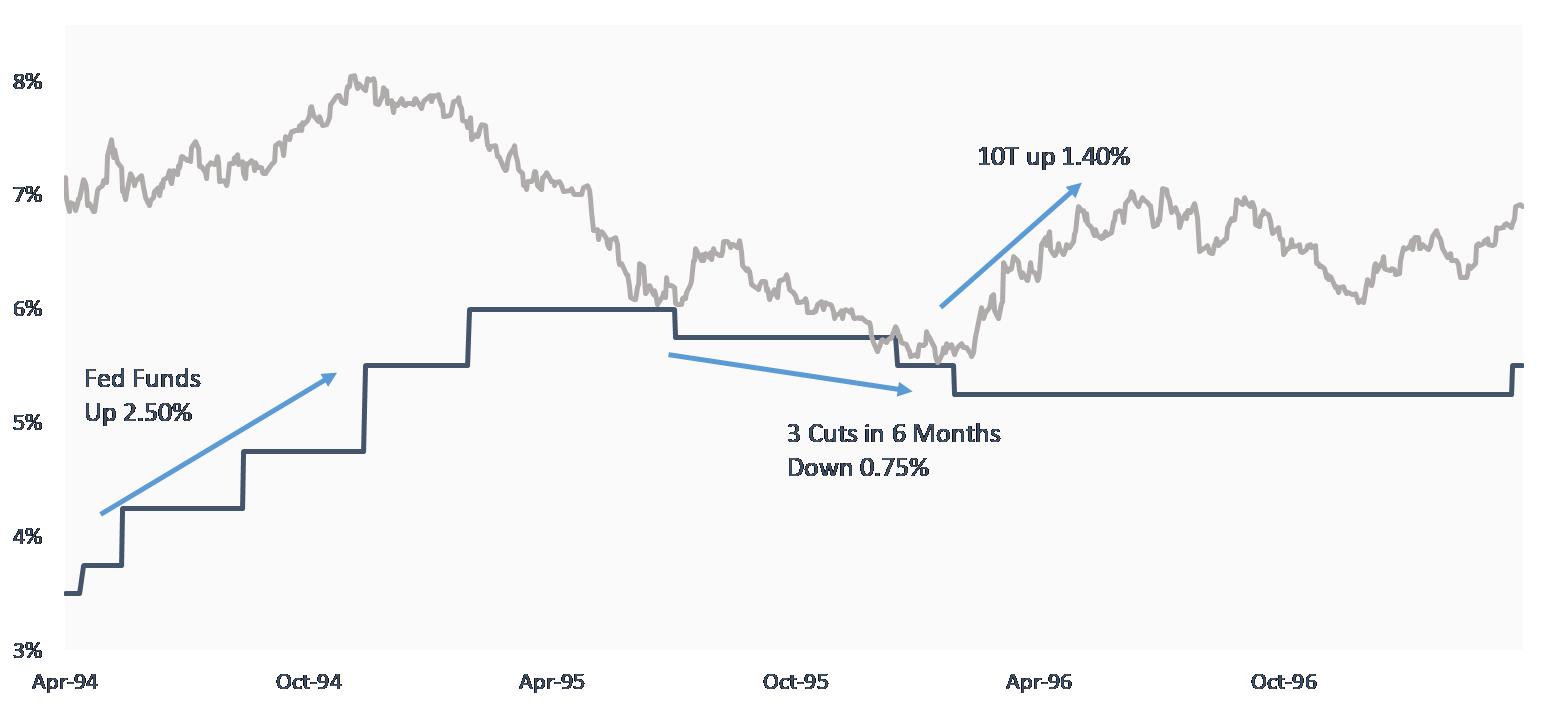
1994-1995 Tightening Cycle
The Fed hiked 2.50%
The T10 collapsed and landed on top of Fed Funds.
The Fed did nothing for six months.
Any of that sound familiar?
But then the Fed cut rates three times (0.75%) in six months.
That move actually reassured the market that the Fed wasn’t going to hike the US into a recession, and the 10T actually climbed more than 1.40% in a few months.
Rate cuts may be the only way the 10T tests 3.00% by year end.
If the Fed cuts rates
and
If the market thinks the Fed is cutting rates proactively rather than because we are already in a recession
and
All the event risk listed earlier in the newsletter fails to materialize/escalate
and
The trade war is resolved
and
The rest of the world doesn’t enter into a recession
then
Maybe the 10 Year Treasury tests 3.00%. Maybe.
So you’re saying there’s a chance…
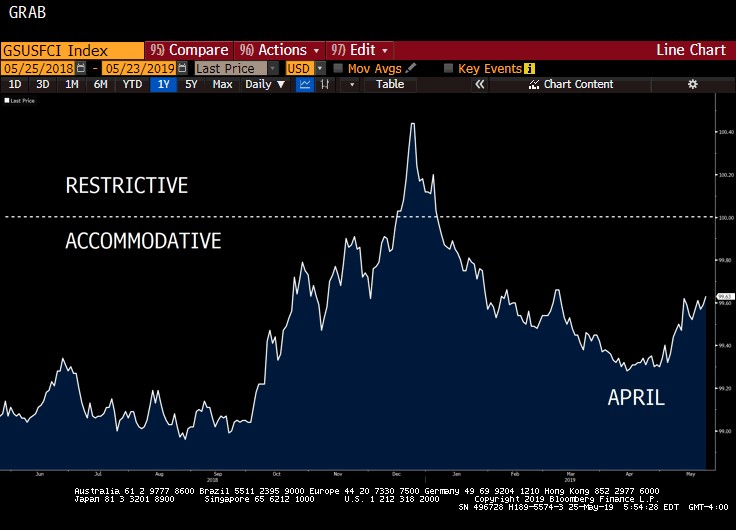
Financial Conditions
No surprise here, but financial conditions are tightening.
This Week
Trade war.
It’s just…whatever.