

Last Week This Morning
- 10 Year Treasury hit 2.125%
- German bund at an all-time low of -0.21%
- Japan 10yr at -0.10%
- 2 Year Treasury closed at 1.92%
- LIBOR at 2.43% and SOFR at 2.40%
- Market now has two rate cuts priced in 2019
- JPM now calling for 2 cuts this year, Barclays 3 cuts…and Goldman still calling for one hike by the end of 2020
- Trump announced 5% tariffs on Mexican imports to begin June 10, which will escalate to 25% unless the country takes steps to stop the flow of migrants into the US (he probably believes this means Mexico is paying for the wall)
- Italy’s budget deficit is becoming an issue again
- Q1 GDP was revised down from 3.2% to 3.1%
- Core PCE Q1 was revised lower from 1.3% to 1.0%
FOMC – Policy Shift Coming?
The direct impact on data like GDP, jobs, inflation, etc. will not show up in time for the June 19th FOMC meeting, so we don’t expect the Fed to change its current stance.
Right now, the Fed is just trying to weather the market storm. Is this a knee-jerk over-reaction? Or is the market just ahead of the curve and the downturn is on the horizon?
Current market odds of rate cuts
7/31 – 48%
9/18 – 75%
By Y/E – 95%
Furthermore, there is a 70% probability of two cuts by year end.
At this time next year, the forward curve has 1mL at 1.70%.
We doubt the Fed makes a material shift in policy yet. The data hasn’t weakened enough to warrant a shift. But it will likely signal a willingness to adapt to changing conditions and sensitivity to financial conditions.
The only way we see the Fed making a change before July 31st is if the market enters a full nose dive.
Here’s a link to our forward curve with imbedded shock features in case you want to use the forward curve but also shock potential outcomes.
https://www.pensford.com/resources/forward-curve/
10 Year Rates – Is This the Bottom?
The 10 Year Treasury hasn’t traded below 2.0% since before the 2016 election. It briefly tested 2.0% in the spring of 2017 after Trump’s attempt to repeal Obamacare failed, leading the market to wonder if other Trump policies would also fail. If all those policies had driven up inflation expectations, and Trump would be unsuccessful enacting them, the T10 shouldn’t be trading at 2.50%.
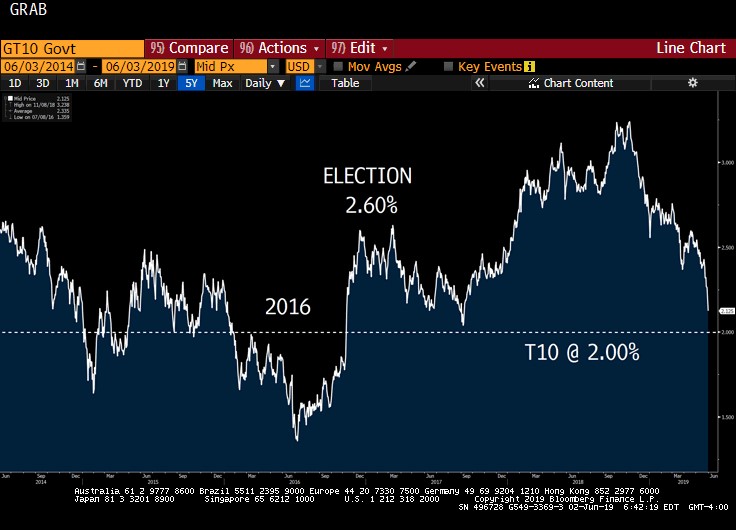
The 10 Year Treasury hit an all-time low of 1.36% in 2016, but that story really began in 2015. As I’ve written here numerous times, the second half of 2015 felt like a recession here at Pensford. Volume plummeted. I remember talking to a well-known hedge provider in December 2015 who was ramping up hiring at the exact moment we were discussing how cap volume had fallen off a cliff.
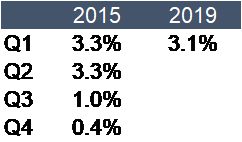
Take a look at GDP in 2015, ahead of the 10T bottoming out in mid-2016. Like cap volume, GDP fell off a cliff in the second half of the year. This is why the market is worried.
While it’s easy to say, “Business is good now, demand is strong, delinquencies are low”, the market is forward looking.
Based on current conditions, should the T10 be trading at 2.12%? No. If GDP is north of 3.0%, the T10 shouldn’t be testing 2.0%.
But…because the market is forward looking, it’s worried GDP will fall off a cliff in the second half of this year. A trade war between the two biggest economies in the world has to be a drag on GDP, right? So the market is moving ahead of that expected slowdown.
- The Atlanta Fed’s GDPNow is predicting Q2 GDP to come in at 1.3%
- The NY Fed’s Nowcast is predicting Q2 GDP to come in at 1.5%
Trade war tensions aren’t to blame for these low projections because that impact won’t be felt until later this year. The market is worried it can only get worse from there.
Since the current data is pretty strong, it’s clear that the market is in a panic risk-off trade. Earlier this year, BNP Paribas released a new metric on Treasury yields in an attempt to capture relative values – basically yields relative to data.
Based on this model, 10 Year Treasury yields are 2.5 standard deviations too low. All else being equal, the 10 Year Treasury should be trading at 2.60%. Even without a quick resolution to the trade tensions, BNP is calling for a small bounce in the near-term based purely on relative values.
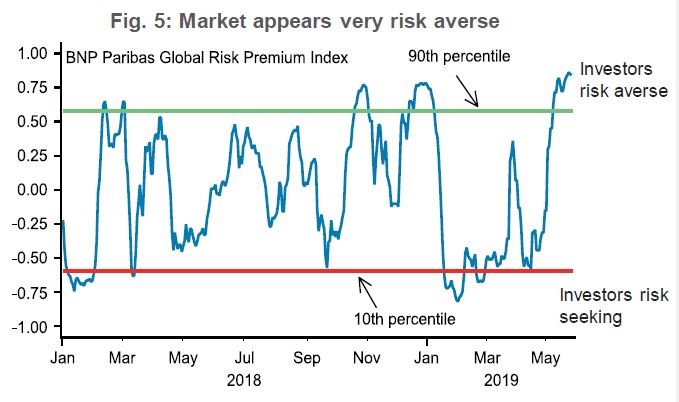
One convenient conclusion may be that if Trump tweets out a resolution to the trade war with China, yields will rebound sharply. But BNP notes, “From a quantitative perspective, our back testing indicates when yields have deviated from fair value by more than one standard deviation, it takes 3-12 months for convergence to take place.” For this reason, BNP is also calling for a slow grind higher to 2.50% the rest of the year.
While a Trump tweet could push yields up quickly, the 10T is unlikely to spike to 2.50% in a few days.
Perhaps the real question is whether the current environment is a temporary slowdown or the precursor to a recession.
- If GDP holds steady (or even doesn’t fall as much as feared), the T10 should rebound. The 2.00% support level should hold.
- But if GDP falls more than expected, the 2.0% could be broken.
Next GDP release is on June 27th.
This Week
All of this takes a backseat to China and surprise Trump tweets, but we do have some important manufacturing data, factory orders, and on Friday the next jobs report.