

This Antonio Brown drama was totally orchestrated, right? Throw a temper tantrum since the Steelers wouldn’t renegotiate the contract you signed the year before and force a trade. Try to get traded to Patriots, but can’t because the Steelers aren’t dumb. Plan on ramping up the crazy until the new team releases you. Unfortunately, get traded to a team with a crazy bar much lower than any other team, requiring you to really up the drama. Force the team to fine you so you can say you won’t play without guaranteed money. Then force that team to cut you because now they don’t owe you any money and you are such a headache.
You are a free agent – exactly what you wanted all along.
Sign with whichever team you want. If that happens to be a Super Bowl contender in the twilight years of the GOAT QB that just lost its best receiver (albeit a TE) and will have plenty of targets to send your way, so be it.
And I don’t mean to suggest AB orchestrated this…the Patriots did. Probably with Goodell’s blessing.
Last Week This Morning
- 10 Year Treasury finally moved higher on the week, hitting 1.60% on Thursday before closing out the week at 1.56%
- German bund moved higher to -0.64% (that feels weird to type)
- Japan 10yr also moved up to -0.24%
- 2 Year Treasury grinded slightly higher to 1.54%
- LIBOR at 2.05% and SOFR at 2.21%
- Yield curve and flipped positive throughout the week
- Thursday’s volatility followed an announcement that Chinese and US delegates would meet in October
- Manufacturing data suggested contraction in that sector
- The economy added 130k jobs last month, below expectations of 160k
- The unemployment rate held steady at 3.7%
- Average hourly earnings came in higher than expected, leading some to wonder if stagflation could become an issue
- On Friday, Powell said, “the Fed…has seen fit to lower the expected path of interest rates and that has supported the economy,” and added the Fed does not see a recession on the horizon
- Trump tweeted about Powell, “Where did I find this guy Jerome? Oh well, you can’t win them all!” Agreed, we definitely can’t win them all…
Jobs Report
The economy added 130k jobs last month, lower than the forecasted 160k. While 130k still sounds relatively strong, keep in mind that 25k of those came from census workers. Netting those, the real gain was just 105k. Furthermore, June and July were revised lower by a combined 20k.
That puts the three-month average at 156k. The same time last year was 241k.
And the private sector added just 96k jobs, below the Fed’s own monthly breakeven estimate of 115k-145k.
It wasn’t all negative, however. The unemployment rate held steady at 3.7% despite the participation rate increasing. Average hourly earnings also climbed, suggesting inflation is slowly creeping into wages (at least until employers start laying off workers).
While 105k jobs gained still isn’t anything to sneeze at, keep in mind that NFP tends to move negative without warning. The fact that we are trending lower is a bad sign. Trade wars fears are clearly having a psychological effect on employers.
10 Year Treasury to 1.00%?
On July 8, 2016, the 10 Year Treasury set a new all-time low of 1.36%.
While we technically got though July this year without setting an all-time low, we are clearly testing those levels again. Market forwards on the 10 Year Treasury are 1.36% for the next three years. That can’t be a coincidence.
Below is a graph illustrating the 10 Year Treasury over the last five years. It bottomed out in July 2016, but had rebounded to 1.75%-ish within a few months. It took Trump’s election, however, to really cause it to spike.
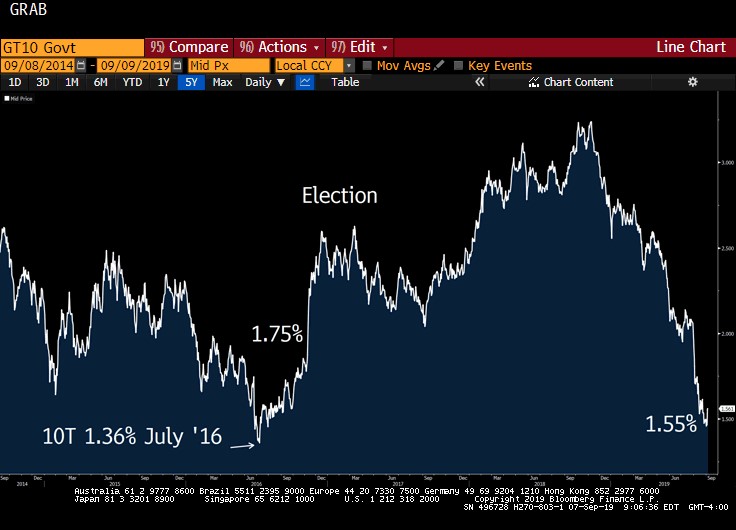
All else being equal, this suggests the 10T could rebound from current levels, maybe as high as 1.85%. But a break above 2.00% feels unlikely in the near term. In 2016, I wrote a newsletter wondering if the 10T could hit 1.0%. Obviously, it did not. But maybe it could this time. What could cause the 10 Year Treasury to breach the 1.36% level and test 1.00%?
Reason # 1 – Global Yields
According to a Bloomberg article this week, central banks have delivered 32 interest-rate cuts globally this year and markets have priced in 58 more rate cuts over the next year. Cumulatively, that would translate into a total drop of about 30%.
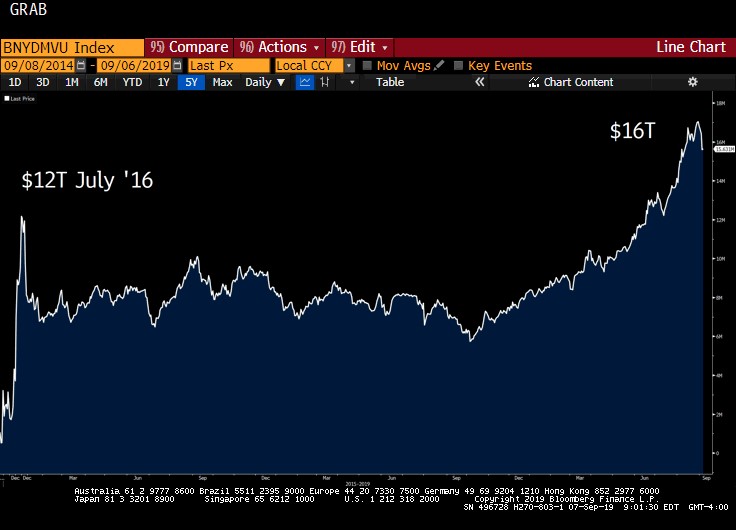
There is $16T in global, sovereign, negative yielding debt. That has increased 3x since last October.
Notice how negative yielding debt spiked in July 2016, the exact same time the 10T bottomed out. That spike was temporary, and perhaps that led to the 10T rebounding to 1.75%.
Today, negative yielding debt is $16T and isn’t set to plunge like it did in 2016. That suggests there could be continued downward pressure on yields domestically.
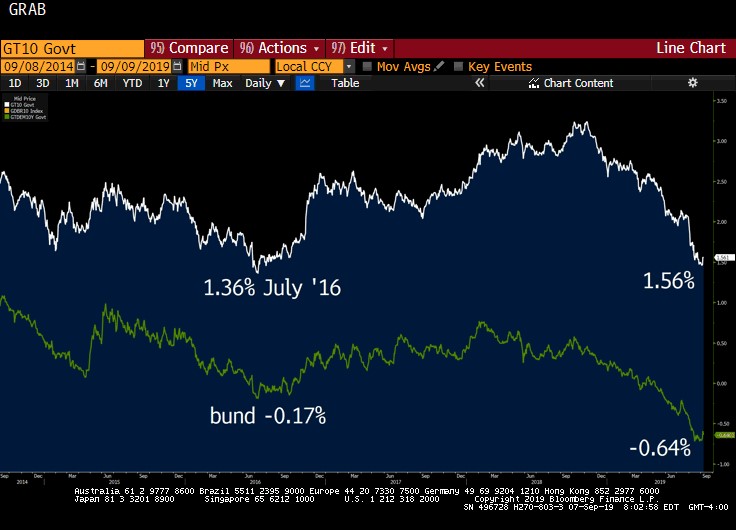
Let’s compare the primary alternative to UST’s, the German bund. In 2016, the bund was -0.17%. Today it is -0.64%. That suggests there is room to drag our own 10T lower.
Reason # 2 – Lack of Inflation
My next thought was – what did inflation look like in 2016? If it was higher than today, it would suggest there may be downward pressure available now. But CPI in July 2016 was 0.8% vs today’s 1.8%. Shoot, there’s goes that theory…
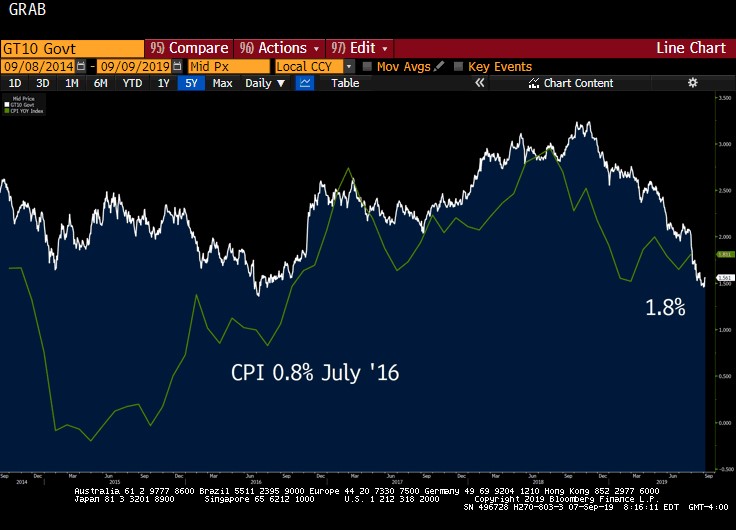
But then I remembered markets are forward looking. It isn’t current inflation that matters, it is inflation expectations that matter. Current inflation could be 3%, but if the market expects it to fall to 0% over the next five years, rates will plunge.
So, what did inflation expectations look like in 2016?
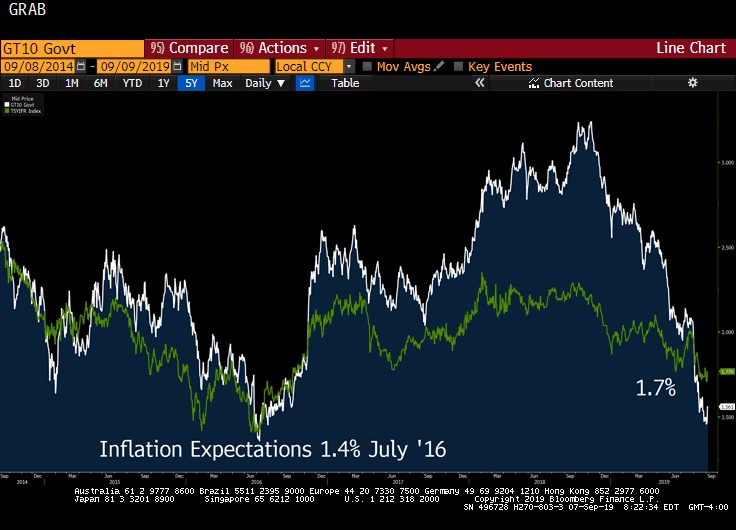
Inflation expectations were slightly lower than today. That suggests the T10 shouldn’t necessarily fall because of lower inflation expectations unless those expectations fall from here.
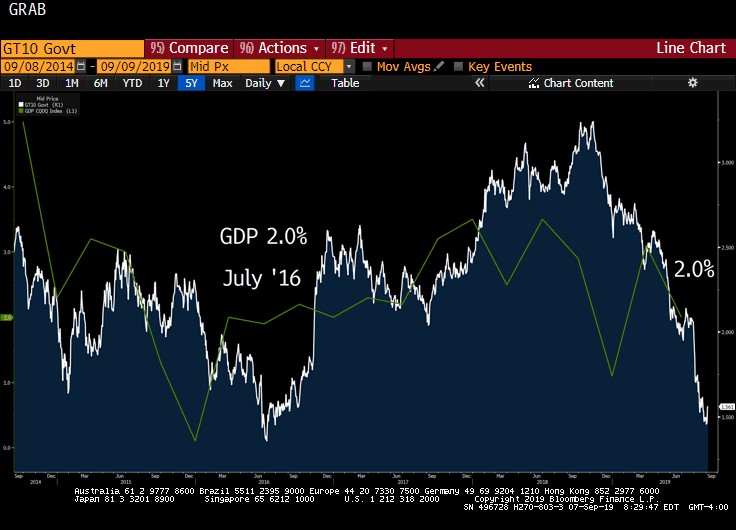
Reason # 3 – It’s the Economy, Stupid
What about GDP?
In July 2016, it was 2.0% – the same level as today. But a year ago it was above 3% and consensus forecast is for it to fall further. At a minimum, GDP is likely to keep a lid on yields, and at worst become a drag.
Takeaway
BNP Paribas has a great Treasury Relative Strength Index (RSI) that helps identity if the 10T is overbought or oversold. Based on last week’s moves, the 10T is right on top of the appropriate value.
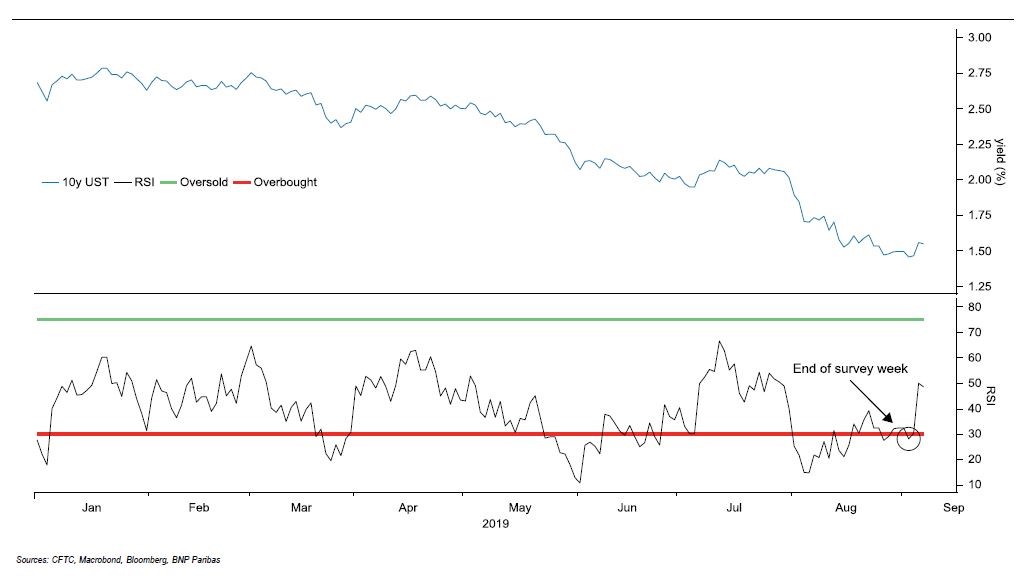
Global yields, inflation, and GDP will dictate where the 10 Year Treasury goes from here.
If the ECB intervenes aggressively, the global printing presses turn back on, Trump-China trade disputes resolve, and inflation ticks up, the 10T could move higher.
But if the global economy slows, inflation falls, and the economy contracts, can we really rule out a 1.0% 10T over the next year?
This Week
Lots of inflation data this week. As we discussed at length above, inflation is a big influence on 10T yields. Barring a shocking number one way or the other, it seems unlikely the 10T will move dramatically ahead of next week’s FOMC meeting.