

Last Week This Morning
- 10 Year Treasury down 0.13% to 2.63% (look at that 2.62% technical level holding like a champ)
- German bund back down to 0.07%
- Japan 10yr yielding -0.03%
- 2 Year Treasury down 0.12% to 2.46%
- LIBOR at 2.49% and SOFR at 2.38%
- NFP came in at a very weak 20k
- The unemployment rate dropped to 3.8% while the participation rate held steady
- Underemployment rate plunged from 8.1% to 7.3%, the lowest since 2001
- Wage growth y/y came in at 3.4% – the strongest in a decade
- The ECB was so dovish that it sent fear through the markets, revising 2019 GDP forecasts down to 1.1% and implying it could be even weaker
- A deal between the US and China now appears more likely
- Trade talks between the US and Eurozone are ramping up and disputes over autos and agriculture making headlines
Job Report
Ouch.
Just 20k jobs were added last month vs a forecasted 170k. The government shut down undoubtedly contributed somewhat, but it cannot be blamed for the entire miss. More likely, this ridiculously terrible weather was a contributing factor. The BLS estimated that up to 80k more than usual workers were unemployed due to bad weather.
Also, don’t forget that last month’s gain was over 300k. Friday’s report probably had some amount of jobs cannibalized by the previous month.
3-month average 186k
6-month average 190k
Markets have been expecting a general slow down in hiring as the unemployment rate dropped below 4%, but this feels like an outlier report.
The last print this weak was September 2017, and the next month had a gain of 260k. If we see a rebound next month, Friday’s report will be discounted. But if we see another terrible print, the market could take a nose dive.
With 101 consecutive months of job gains, this report has been a reliably strong data point to help offset to some other weak report.
If this one goes, watch out.
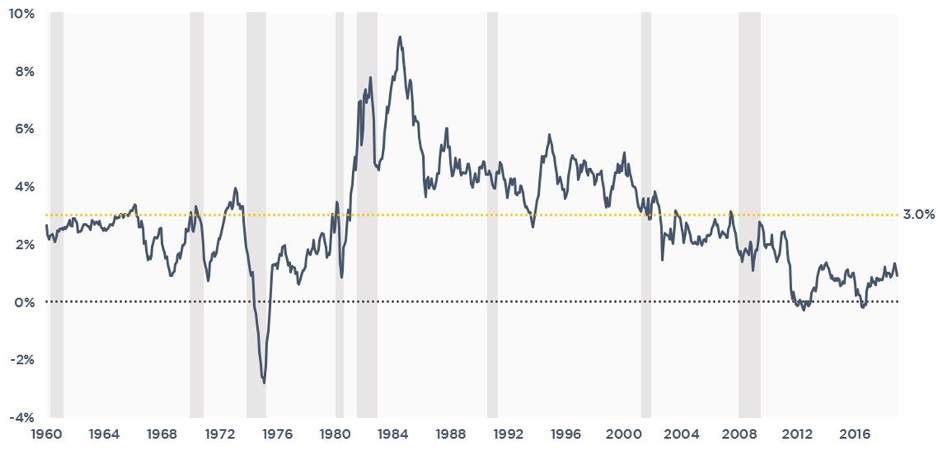
Real Rates – 10 Year Treasury Minus Inflation
Last month, we quoted Bernanke on negative interest rates. He suggested that economists are more comfortable with the concept of negative interest rates than commoners like me because they frequently look at real rates – rates adjusted for inflation. When inflation exceeds yields, we have negative interest rates. In other words, negative rates are not a foreign concept to economists and they don’t get all squirmy at the thought of them.
This made us wonder – is there a correlation between real rates and recessions? (hint: if there wasn’t, you probably wouldn’t be reading about it right now)
Adjusting the 10 Year Treasury for Core PCE and then overlaying grey recessionary bars, we found that there does appear to be a link between recessions and real rates.
The magic number? About 3.0%.
When the T10 minus inflation exceeds 3.0%, recessions follow. We don’t know if 3.00% triggers a recession or if remaining below 3.0% simply helps avoid a recession, but the odds of a recession certainly appear to increase once real rates exceed 3.0%.
As you can see below, real rates are around 1.75%. So how might real rates go up to 3.0%?
- Hold inflation at current 2.0% level and the 10 Year Treasury has to go to 5.00% (good luck with that)
- Hold the 10 Year Treasury at 2.65%, inflation goes negative (doesn’t feel real likely, either)
- Some combination thereof, eg 10 Year Treasury to 3.00% and inflation to 0% (maybe?)
This graph and those scenarios suggest a recession is not imminent, even if the market is spooked right now.
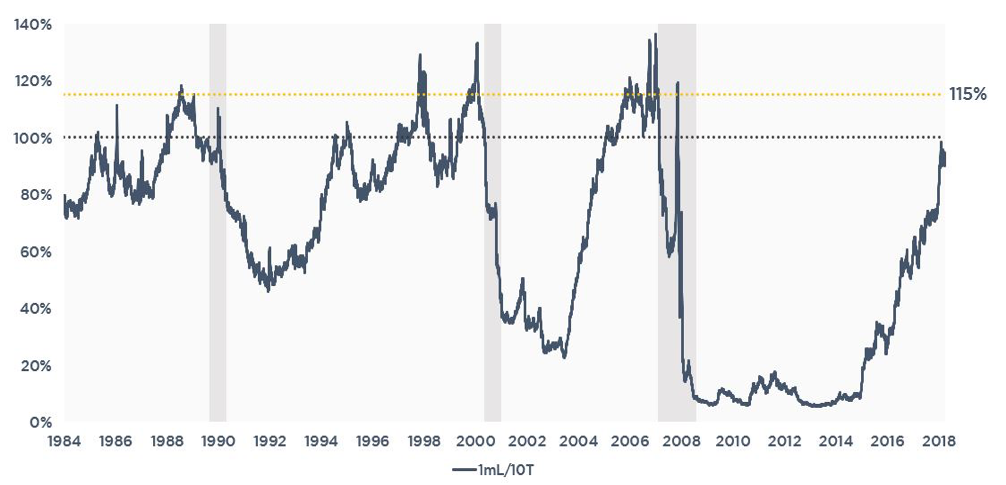
LIBOR-to-10 Year Treasury Ratio
Just for sh*ts and giggles, we decided to tweak the inverted yield curve graph. Rather than looking at 2 Year Treasury yields, we decided to look at LIBOR vs 10 Year Treasury yields.
What we found is that when the LIBOR to 10 Year Treasury ratio breaches 115%, it tends to signal a recession.
If the Fed remains on hold and LIBOR stays around 2.50%, a 10 Year Treasury at 2.17% would achieve this ratio.
That would also imply an inverted yield curve to the tune of 0.30%+, so not sure this is breaking news, but it would seem to reaffirm the predictive value of an inverted curve.
Since the Fed doesn’t have great control over the long end of the curve, it stands to reason they would avoid this scenario by lowering Fed Funds. If the 10 Year Treasury is plunging towards 2.0%, they may have to cut rates.
It shouldn’t come as a total shock that the market is now pricing in a 20% probability of a rate cut this year, while just a 0.6% probability of a rate hike.
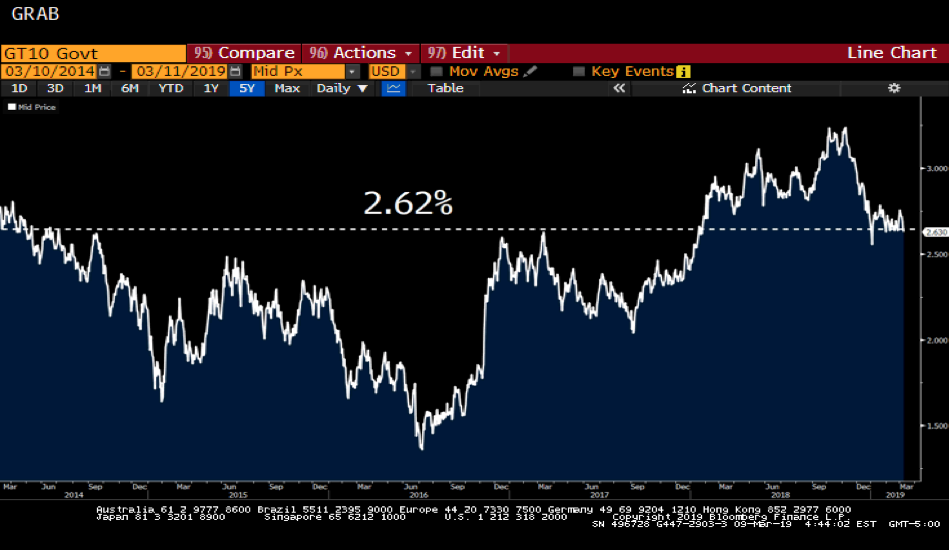
10 Year Treasury Yield
We’ve been beating the drum about 2.62% as a key technical level for two years. If I knew whether the 10T was going through 2.62%, I wouldn’t be writing this right now.
But what I can say is that it is clearly significant. Take a look over the five years how often 2.62% was a key threshold – regardless of whether rates were moving up or down. Keep an eye on 2.62%.
This Week
There’s a chance that the China and US trade dispute will be resolved this week. Do we celebrate the resolution of a self-inflicted wound?
Another Brexit vote will dominate headlines out of Europe, with May likely to suffer another resounding defeat. Unlike last month, however, the MP’s appear ready to vote “yes” to an extension to the March 29th deadline. While this is definitely just kicking the can down the road, it would also help avoid the dreaded “no deal” Brexit.