

Last Week This Morning
- 10 Year Treasury down 0.15% to 2.44%
- German bund went negative for first time since 2016, closing at -0.03%
- Japan 10yr down to -0.08%
- 2 Year Treasury down 0.12% to 2.32%
- LIBOR at 2.49% and SOFR at 2.44%
- Fed effectively announced the end of the tightening cycle
- 3 month vs 10 Year Treasury curve inverted
- Existing home sales up 11.8%, the most since 2015
- Mueller filed his report to the AG and Dems will be more disappointed than a Cavalier fan in March
- PSU won its fourth consecutive national championship in wrestling and 8th in 9 years
On a Short Enough Timeline, I’m Always Wrong
Our newsletter last week began with an entire section devoted to how Treasury volatility was testing all-time lows. I suggested that we might be due for a correction in a few months, but the upcoming Fed meeting was more likely to result in more of the same. To save you the search, “This week’s Fed meeting has the possibility of causing volatility to spike; however, we think it’s more likely to have the opposite effect.” I went on, “Perhaps Treasury yields are set for a period of complacency…followed by a dramatic spike?”
Welp, sh*t.
I jokingly say that on a long enough timeline, I am always right. Maybe on a short enough timeline, I’m always wrong? Here’s that same Bank of America volatility graph from last week.
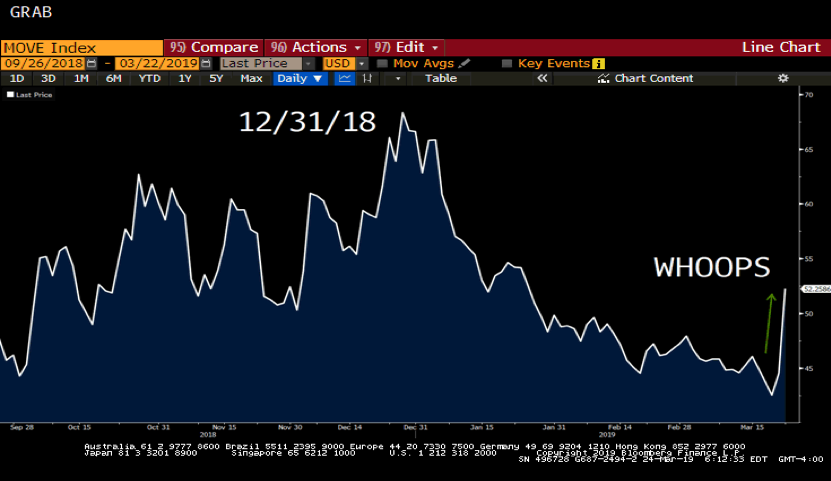
Maybe the scariest part of that graph is that last week’s move still doesn’t put volatility anywhere close to volatility levels as recently as December.
What Does the New Fed Position Mean?
Forward Curve
The market is now pricing in a 50% probability of a rate cut by the October FOMC meeting and a 70% chance of at least one cut by this time next year.
Here’s the forward curve snapshot following the meeting.
12/31/19 2.30%
12/31/20 2.00% (that’s two cuts by the end of next year!)
12/31/21 1.96%
Please note that actual LIBOR is unlikely to tick lower until the market is pricing in an imminent cut. In general, LIBOR will stay flat until we are within a 30-day window (hence 1 month LIBOR) of an actual cut. For example, if we get to early October and the market is pricing in a rate cut at the 10/30 FOMC meeting, LIBOR will start drifting lower. Don’t expect much change until that cut is imminent.
Swaps
Depending on the bank’s credit charge, swap rates are now below current floating rates. Breakeven swap rates are below (notice how 5 year swaps are lower than 3 year swaps).
3 year 2.17%
5 year 2.16%
7 year 2.20%
10 year 2.29%
Call us if you want to discuss whether or not it makes sense to lock at these rates. We can certainly understand the appeal of converting to fixed and immediately lowering the interest rate, but please don’t call it a no-brainer (https://www.pensford.com/if-i-can-lock-in-fixed-below-my-floating-rate-should-i/).
Caps
We wrote a newsletter in early January after Powell started backpedaling and explained why cap prices hadn’t plummeted. The takeaways were that Powell wasn’t sending of a cut yet and LIBOR at 2.50% put it close enough to most strikes that traders had to price in some probability that they were wrong and the cap might still be in the money at some point.
Well that has changed. Check out a $25mm 3 year cap at 3%:
Today $ 28k
September 2018 $190k
While caps won’t be as cheap as they were between 2012 and 2015, the Fed’s new position should really help keep cap costs depressed for the foreseeable future.
And if the market is right about rate cuts, caps will feel better than swaps.
Lastly – negotiate those floors!
Financial Conditions
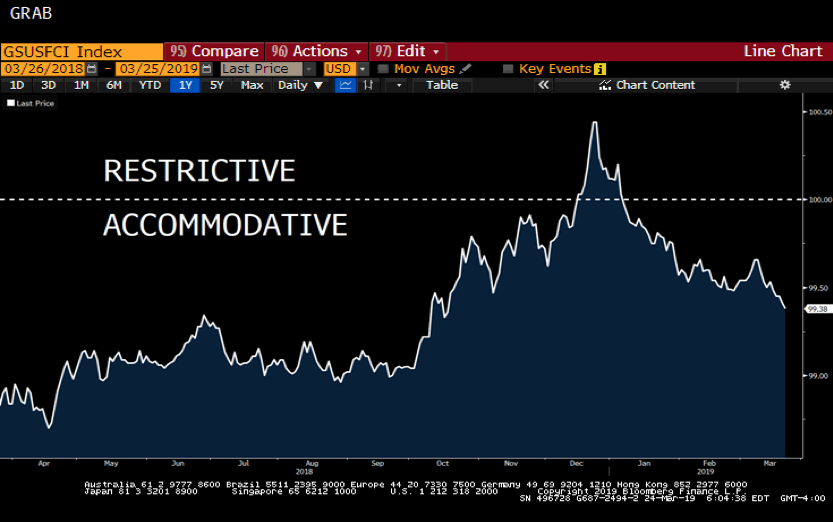
You know this is one of my favorite graphs, so of course it’s being included. Despite the volatility, the revised Fed stance should continue to loosen financial conditions. This is the sort of graph that gives me hope the recession is not imminent. Or at least that it won’t be induced by monetary policy.
Yield Curve Inversion
The traditional measure of yield curve inversion is the delta between the 2 Year Treasury and the 10 Year Treasury.
Remember that the 2 Year Treasury effectively represents what the market thinks LIBOR will average over the next two years. Because the market is pricing in rate cuts, the 2 Year Treasury plunged.
That drop in front-end rates is what prevented the yield curve from inverting when the 10 Year Treasury dropped to 2.44%. Here’s a link to our inverted yield curve study we published last year that examined the traditional measure of steepness: https://www.pensford.com/resources/yield-curve-inversion-study/
But a less traditional measure of yield curve steepness did invert last week – the spread between 3 month Treasury bills and the 10 Year Treasury. Three month T-bills (2.46%) are now yielding more than the 10 Year Treasury.
Even perma-Trump bull Larry Kudlow last year said this measure is more meaningful than the traditional measure, “It’s actually not 10s to 2s: it’s 10s to 3-month Treasury bills,” Kudlow said in May. “Very important.” I bet the blame this time falls on the new Democratic House…
Bianco Research noted that the 3-month T bill yield exceeded the 10T six times in the last 50 years, and in every case a recession followed. On average, the recession began 311 days after the inversion.
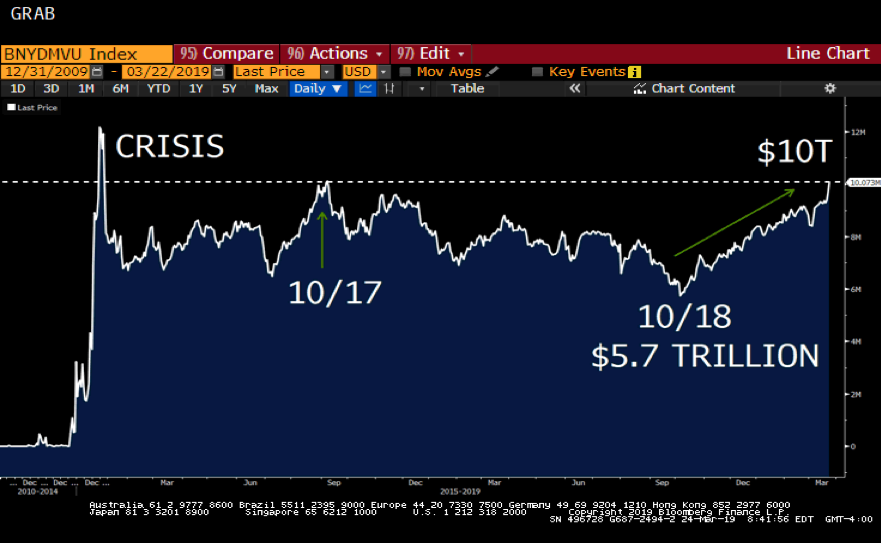
This comes at a time when global yields are tumbling as well. Here’s the Bloomberg/Barclays global negative yielding debt graph.
In the last six months, the amount of negative yielding debt is up 75%, matching October 2017 levels and exceeded only by the time period immediately following the crisis.
10 Year Treasury – Good Predictor?
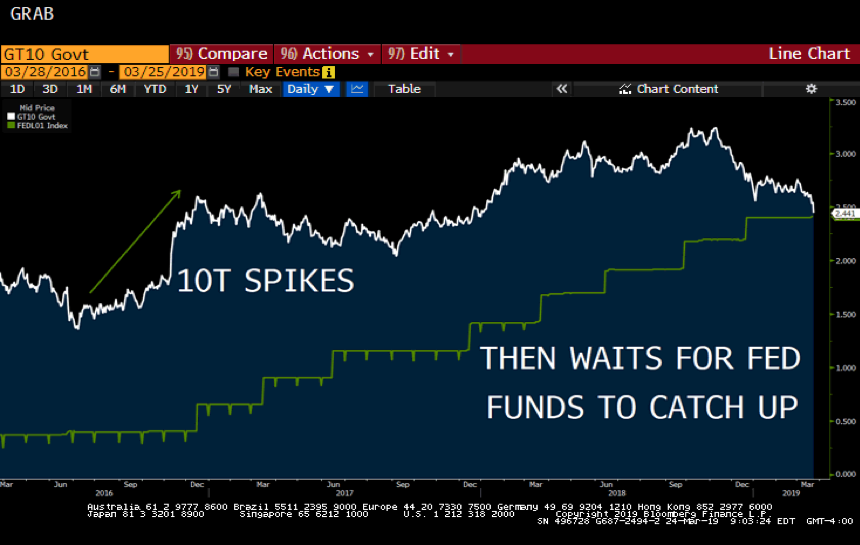
Below is a graph illustrating how the 10 Year Treasury moves first, and then waits for short term rates to catch up. That’s why locking rates at the beginning of a tightening cycle is usually the second worst time to fix a rate (teaser alert). It’s the worst of both worlds.
Your interest expense immediately increases when you could have gradually floated higher instead, plus after the initial jump the long-term fixed rates settle down as they wait on the short term rates to catch up.
You’ll also see how the 10 Year Treasury is constantly adjusting, trying to guess at the ultimate landing spot for short term floating rates. The 10T yield does a reasonably good job of predicting the path of Fed Funds, but mostly in a directional sense. It’s good at saying “rates are going up” but not quite as good at predicting the final landing spot with precision.
Is the same true when rates move lower? Does the 10T plunge and then wait for Fed Funds to catch up?
Maybe.
We went back to the last three rate cutting cycles to see how the 10 Year Treasury did at predicting rate cuts.
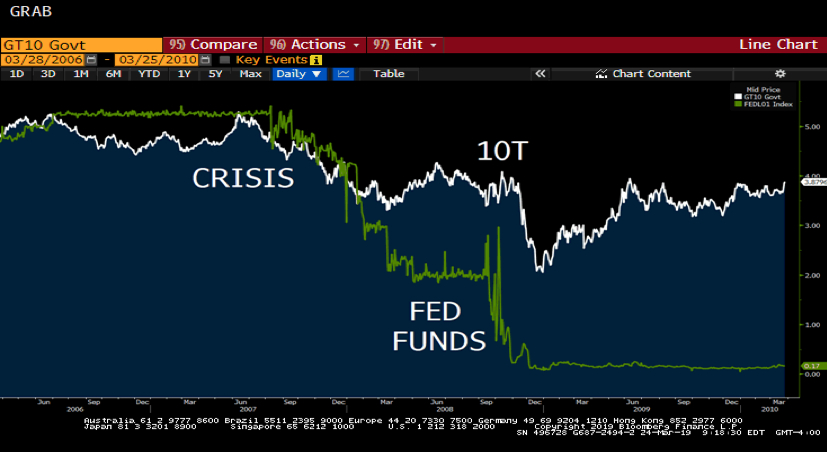
2008 Financial Crisis – 10T Does Not Really Move First (maybe a little, but not much)
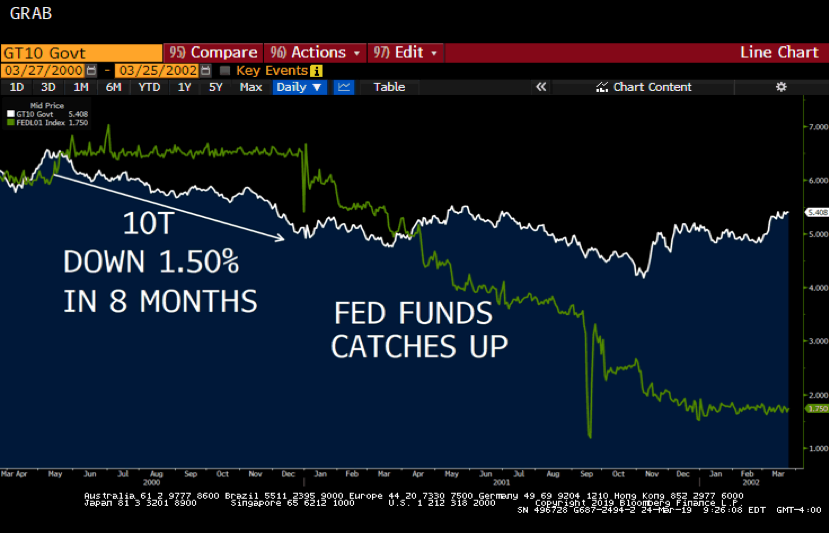
2000 Dot Com – 10T Does Move First
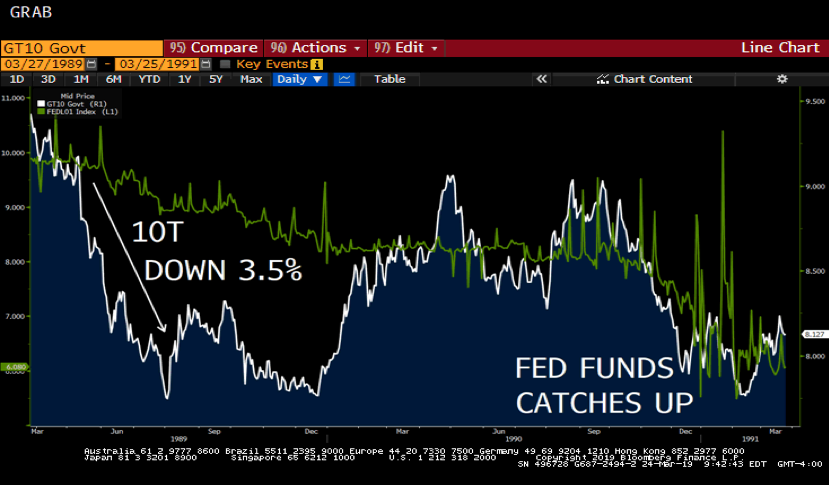
1990 Rate Cuts – 10T Does Move First
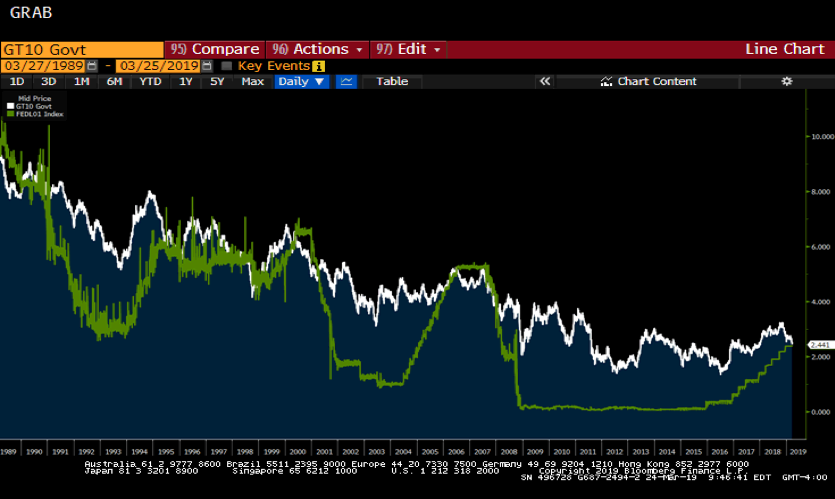
1989 Through Today – Lack of False Positives
That muddies the waters a bit, doesn’t it?
What I find interesting is that when the 10T moved lower, Fed Funds also moved lower eventually. The 10T might not always do a good job of predicting a drop in Fed Funds well in advance, but if the 10T moves lower then Fed Funds also moved lower.
In other words, there is a lack of false positives.
Maybe the 10T stays flat or rebounds a little and we avoid the classical definition of an inversion. The economy keeps chugging along.
But if the 10T plunges below 2.00% in the coming months, it is likely a strong signal that the Fed will be cutting rates. And it will probably be due to a recession that will come in about 12-18 months.
Last week we said to be on the lookout for the 10T breaking through the 2019 low of 2.54%. We blew through that quickly and are now at the lowest level in 14 months. While the current data doesn’t support a push to 2.00%, we just showed that the 10 Year Treasury commonly moves in advance of Fed Funds and then waits for those rates to catch up.
While a sub-4.00% Unemployment Rate and 2.00%-ish GDP don’t sound recessionary, we can’t ignore the signals that those numbers may weaken materially and the 10 Year Treasury is simply moving in advance and then will wait for everyone else to catch up.
I mentioned earlier in my teaser alert that locking in a fixed rate at the start of a tightening cycle is generally the second worst time to lock in a rate.
The worst time to lock in a fixed rate?
When the curve inverts.
Just in case you skipped over the no-brainer link earlier, here it is again:
(https://www.pensford.com/if-i-can-lock-in-fixed-below-my-floating-rate-should-i/)
This Week
Big week. Lots of Fed-speak this week as Committee members try to massage the message from last week’s meeting. Thursday brings GDP. Friday brings Core PCE, the Fed’s preferred measure of inflation.