

New Resource – Index Comparison Calculator
With the transition away from LIBOR continuing to pick up momentum, various new indices have begun seeing use which leads many to ask “which one is best for me”? Introducing the Pensford Index Comparison Calculator. Some features include:
- Ability to run a side by side comparison on up to three indices to determine which might be most beneficial based on current market projections
- LIBOR, BSBY, Term SOFR, simple average SOFR, and ISDA (fallback) SOFR
- Check back soon for AMERIBOR
- Ability to shock the curves
- Incorporate amortization
- Take into account loan spreads or index adjustments
Last Week This Morning
- 10 Year Treasury plunged Friday to 1.34%, a two-month low
- German bund down 5bps -0.39%
- 2 Year Treasury spiked to 0.64% during Powell’s testimony, before closing at 0.59%
- LIBOR at 0.10%
- SOFR at 0.05%
- The economy added 210k jobs, the slowest gain in a year
- Consensus forecast was 550k
- We’re about 3.9mm jobs short of Feb 2020 levels
- The unemployment rate dropped to 4.2%
- The participation rate actually climbed, reaching its highest level since Covid
- Goldman revised downward GDP forecasts
- 2021: from 4.2% to 3.8%
- 2022: from 3.3% to 2.9%
- In that same report, GS “continues to expect the FOMC to double the pace of tapering at the December meeting and then to deliver the first rate hike in June 2022.”
- New home sales spiked 7.5%
- ISM Non-Manufacturing logged its highest print ever since the series began in 1997
- Powell, “The economy is very strong and inflationary pressures are high,” he said. “It is therefore appropriate in my view to consider wrapping up the taper of our asset purchases. . . perhaps a few months sooner.”
- He did note that he expects inflation to abate “significantly” next year
- Powell also noted it’s time to retire “transitory” from the Fed’s vocabulary
- The Covid Omicron variant has made it stateside
Jobs
Friday’s job report was stronger than the headlines suggest. Although the economy added just 210k jobs through the BLS survey (the headline), the household survey showed a gain of 1.1 million. In the Bloomberg graph below, the orange line is the typical NFP print, while the white line is the household survey.
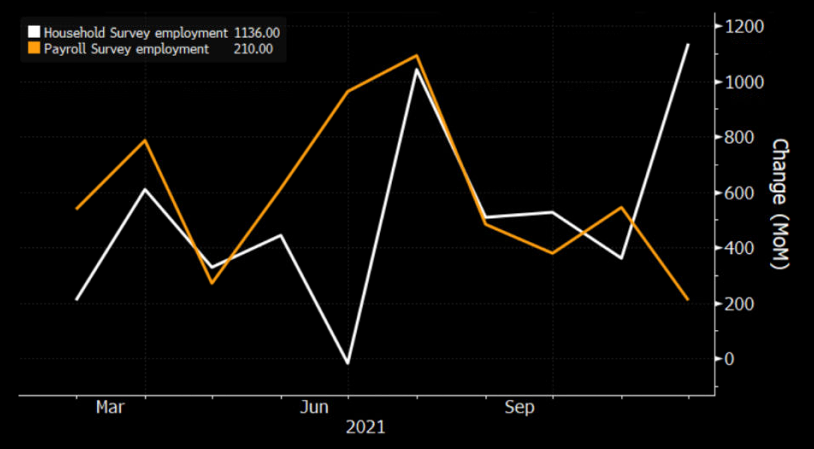
Source: Bloomberg Finance, LP
We have had six consecutive months of upward revisions, so there’s also a chance that Friday’s number is revised higher in the coming months.
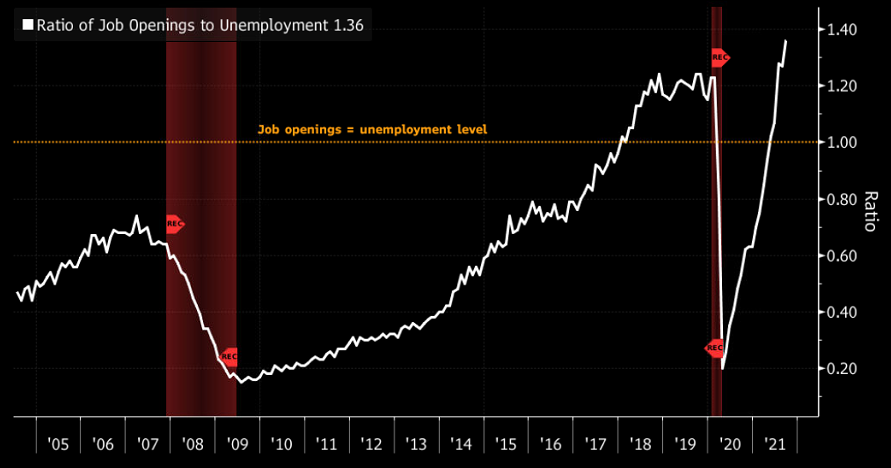
The big winner of the day was the Unemployment Rate, which dropped to 4.2%. A surprise drop usually corresponds with a caveat like, “but much of that is attributable to a drop in the participation rate.” But not this time. The participation rate actually increased, adding legitimacy to the number.
In the survey, 58% of job seekers indicated jobs are “plentiful”, whereas only 11% said jobs are “hard to get”. Check out the ratio of job openings to unemployment in the graph below. I think this returns to equilibrium as the Great Resignation gives way to the Great Oh Shit I Have Bills to Pay, but it’s a big reason why employers are having to pay up for talent right now.
Source: Bloomberg Finance, LP
Although the job report is largely positive, there are reasons to look beyond the 4.2% headline UR and be mindful that we still have room to go.
- Using the participation rate from Feb 2020, the UR is still 6.5%
- Still 3.9mm jobs short of Feb 2020 levels
- Black unemployment dropped 1.0%, but the headline UR is still at 6.7%
- Using the participation rate from Feb 2020, it’s closer to 9%
- Long-term unemployment (six months) is still 1.1mm more than Feb 2020
- The # of part-timers wanting full time work is 4.3mm
- The # of people not in the labor force but wanting a job is still 850k higher than Feb 2020
- The “real” unemployment (U6) is still almost 8%
10 Year Treasury
The 10T plunged to a two-month low and I have to say – I’m a little surprised at these levels.
I don’t believe Friday’s plunge was a result of the weak 210k jobs number. Traders know everything I pointed out above.
Remember a month ago when we talked about how Powell would need to ramp up rate hike rhetoric to help rein in inflation expectations? Even if Powell has no intention of hiking in 2022, he wants the market to believe he might. I think it’s working.
The market believes the Fed will hike in 2022…which will dampen inflation…and that higher rates will be a drag on growth…and covid variants are still a threat…all of which translate into lower yields.
This Friday’s CPI is going to be crazy high. We might get a 7% print (forecast is 6.9%) and it will likely be the highest reading in 40 years. And it will probably be that high next month, too. The market believes these sort of inflation prints will bully the Fed into rate hikes next year, which is driving up front end rates.
That’s why the curve flattened. The 2 Year Treasury yield is up because the market expects the Fed to hike, but 10 Year Treasury yields are down because longer term growth and inflation will be reined in.
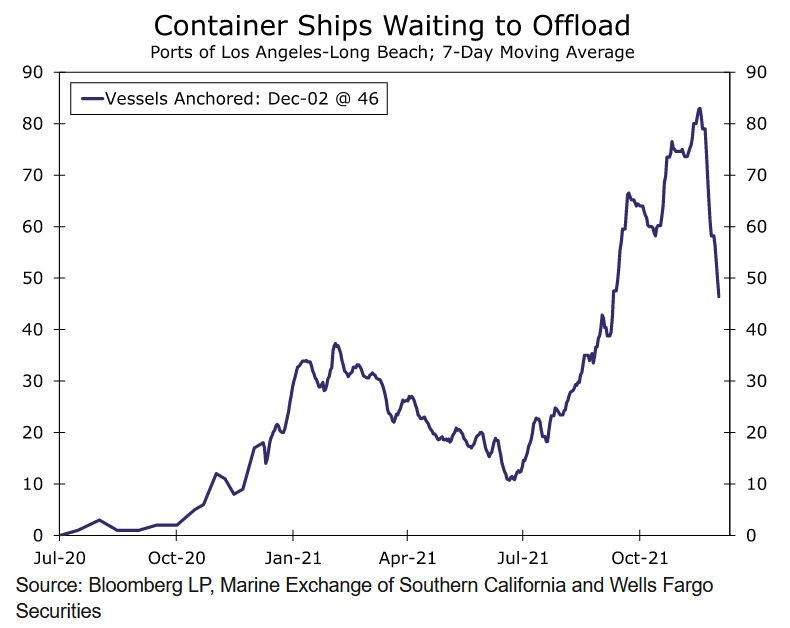
Furthermore, there are finally signs of the supply chain disruptions easing and the market is looking past one or two 7% prints and concluding inflation will ease in the first half of 2022.
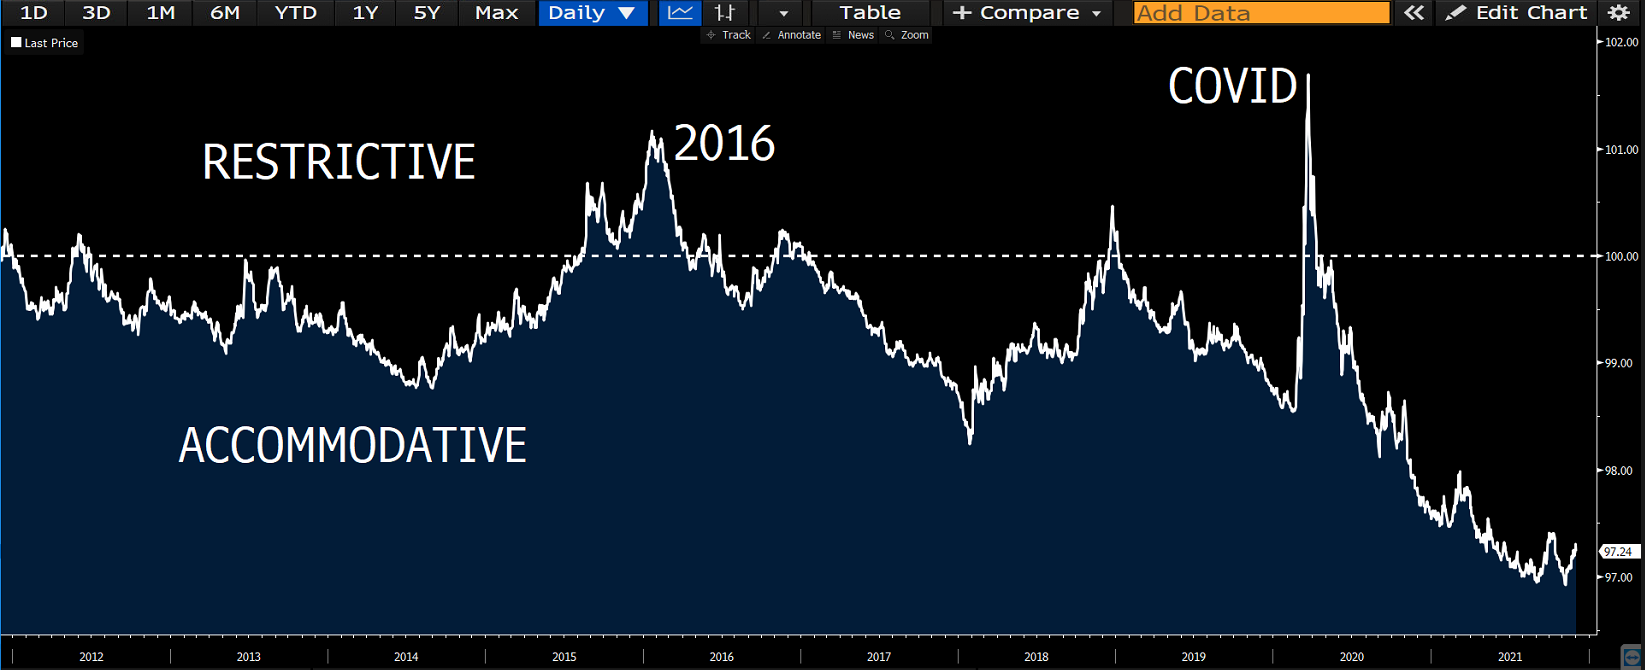
Even though I agree on inflation pressures easing, a 10T at 1.34% feels too pessimistic. Covid variants have each had a subsequently smaller impact on markets/economy. The labor market is improving strongly. Firms are well capitalized. Plus, the Fed is still extremely accommodative as illustrated by Financial Conditions.
Source: Bloomberg Finance, LP
I believe the economy is stronger than the current 10T levels imply and we could see rates rebound. I see two different types of potential corrections.
- Pessimism fades
The more likely scenario where the market changes its mind and decides things are ok. The 10T grinds back above 1.50% and settles in 1.50% – 1.75%.
- Inflation fears
I can’t stress this enough – the market, like the Fed, believes inflation will ease substantially next year. If the market decides inflation will run rampant in 2022 and beyond, fuggedaboudit. The 10T will spike. This is a much lower likelihood, but the correction would be much more dramatic.
Fed Funds
The market is pricing in rate hikes sooner than the Fed is forecasting, with two hikes next year.
But the market also believes the Fed will top out around 1.50%, while the Fed suggests 2.50% as the ultimate landing spot.
In other words, the markets believe hikes will come sooner but stop sooner, too.
This feels reasonable. Powell hikes to cool things off but doesn’t go crazy because he doesn’t want to throw us into another recession.
The market typically overestimates the path of LIBOR. It’s almost always too optimistic…except…
…except when rate hikes actually begin. In the hairy graph below, the solid dark line is the actual path of LIBOR. The grey spaghetti lines represent the forward curve (representing what the market believes LIBOR will do in the coming years).
- the forward curve is usually above the actual path of LIBOR, meaning the market overestimates the path of rates
- But when the Fed is hiking, the market underestimates the path of rates
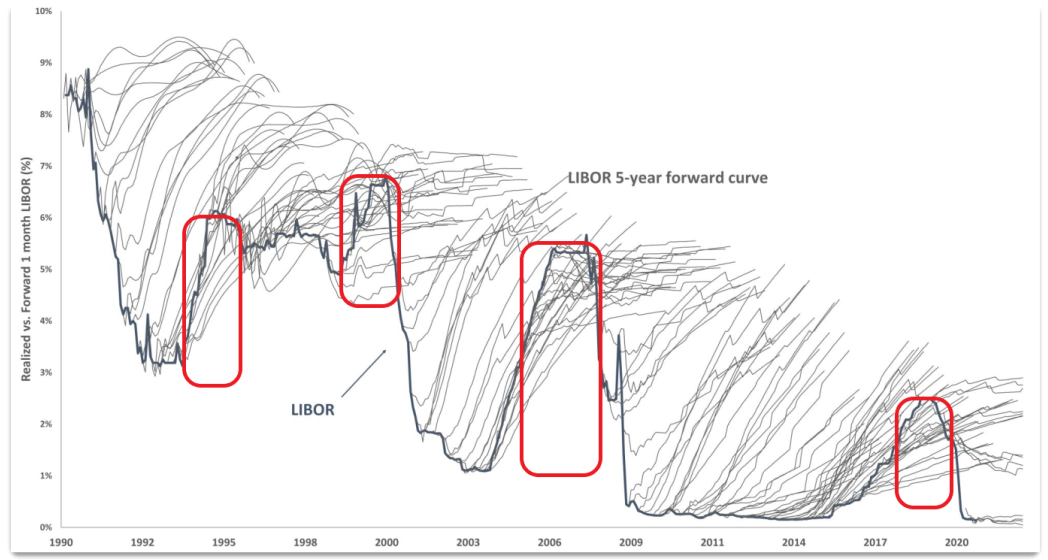
Although I happen to agree with the market that the landing spot is well below 2.50%, precedent suggests otherwise.
In fact, the market has LIBOR peaking late 2024 followed by two rate cuts in the first half of 2025.
Will the market underestimate the ultimate path of rates again? Or will the ultimate landing spot be below 2.0%? Are we really already talking about the next easing cycle?
Week Ahead
Expect Friday’s inflation data and omicron to be the focal points this week as markets prepare for Powell and the Fed to take center stage December 15th for a hotly anticipated FOMC meeting.