

Last Week This Morning
- 10 year Treasury had a quiet week, finishing up 0.02% on the week at 2.89%
- 2 year Treasury had a similarly quiet week, finishing up 0.01% at 2.26%
- LIBOR hit 1.75%
- Economy added 313k jobs vs forecast 205k
- Wage growth (inflation indicator) was disappointing, increasing only 0.1% vs forecasted 0.2%
- Gary Cohn resigned following the announcement of the steel and aluminum tariffs
- ECB made no change to rate policy, but did remove its easing bias.
- committed to QE through September
- this is in line with market expectations of tapering to begin October and a likely end of QE in December.
- ECB may wait until the summer before announcing changes in forward guidance
- committed to QE through September
- German bund finished a benign week relatively unchanged at 0.65%
- Italian elections resulted in the populist party Five Star Movement gaining seats, but not enough to form a majority government.
Job Report
The economy added 313k jobs and the previous two months were revised up by a combined 54k. Boom goes the dynamite.
Although the unemployment rate held steady at 4.1%, this was the result of the participation rate jumping 0.3% to 63.0%. Had the participation rate remained unchanged, the unemployment rate would have dropped to 3.7%.
While current inflation isn’t a real threat, the Fed is convinced the labor market tightness will eventually have to cause inflation. If we keep seeing strong job data, the Fed will likely keep hiking even if Core PCE isn’t moving towards 2.0%.
The lone sore spot in the report was the disappointing wage growth, which showed a 0.1% increase after three consecutive months of upward pressure. Additionally, the y/y growth slowed from 2.8% to 2.6%. Given the strength of the job gains, the Fed is likely to dismiss this dip as “transitory” – a phrase they like to use as much as I like to use “overrated cheap shot artist” when describing Grayson Allen.
Bottom line – rates didn’t pop more because of the lack of wage growth, 4 handle UR, and specter of tariffs. There is a very real risk of a much more dramatic response by rates if wages start climbing again and/or when the unemployment rate drops below 4%.
Inverted Yield Curve
The announcement of the steel and aluminum tariffs should dampen the upward pressure on the long end of the curve. While the job report confirms the current strength of the economy, markets are forward looking and can’t completely ignore the potential impact of tariffs and/or a trade war.
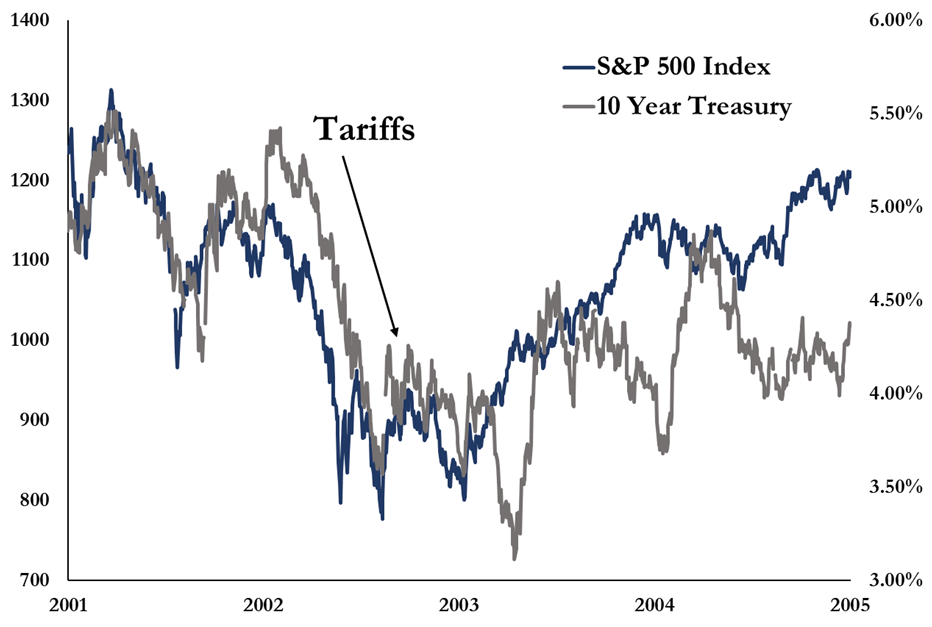
We included this graph last week, but it bears repeating – in the six months following Bush’s steel tariffs in 2002, the S&P fell 34% and the 10T dropped from 5.50% to 3.50%.
After the tragedy in Charlottesville, Gary Cohn publicly stated he was uncomfortable with comments made by Trump…but he didn’t resign.
Following the announcement of the tariffs, Cohn resigned.
I think that tells us the significance that Gary Cohn, former President of Goldman Sachs (not some state school dummy like yours truly), places on this announcement.
We’ve long advocated that expansions don’t die of old age. We aren’t “due” a recession just because the recovery has been underway for seven years or more. Economies don’t just stall out and tip into recession. Something happens, which leads to a recession. Very frequently, it’s a Fed tightening cycle. If steel tariffs lead to a trade war with China, can we really say the US economy will be unaffected?
We’ve also been beating a dead horse over the possibility of an inverted yield curve. The more the Fed hikes, the less the 10 year Treasury needs to fall before it inverts. When the 2 year Treasury was at 1.00%, it was much harder for the yield curve to invert. But with the 2T at 2.25%, it’s not inconceivable that the 10T could dip below that level.
Because the 2T is driven by expectations for Fed rate hikes, the yield is more closely tied to Fed-speak about the path of hikes than whether the Fed hikes in March and June (which are already priced in).
Powell & Co. can help prevent an inverted yield curve by dampening future expectations, rather than simply holding off. If the 10T starts falling, Powell may first signal a reduction in hikes in 2019 and beyond. For example, what if the FOMC suggests a new neutral rate target of 2.50%? It would still allow for four hikes from today and provide more room for cuts during the next recession, but would prevent the 2T from moving higher and help mitigate the risks of an inverted curve.
So what’s the deal with an inverted curve anyway?
There have been times when the economy has entered a recession without an inverted yield curve – in other words, the absence of an inverted curve doesn’t guarantee we will avoid a recession.
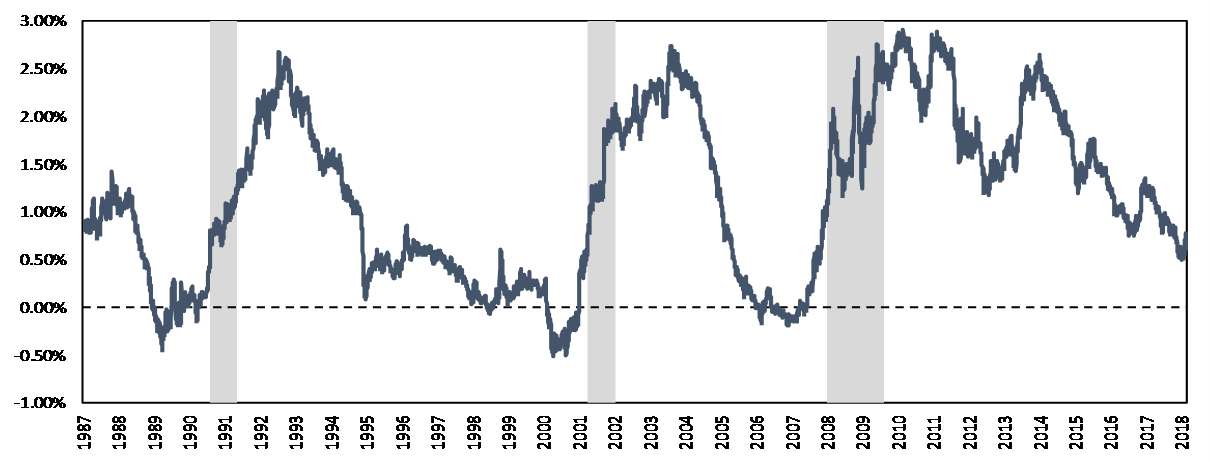
But when the yield curve has inverted, it has always been followed by a recession. We dug into some of the critical takeaways from previous inversions. First, let’s take a look at the inversions since 1987. We used this as a cutoff given how much more significant capital markets developed after this time, but the data from previous inversions tell a similar story.
Average Inversion Length – 648 days
From the time the curve first inverted, to the last day it went positive and didn’t invert again, was 648 days. This surprised us – nearly 2 years of dealing with an inverted yield curve! But the curve flip flops between positive and negative during this time.
Average Inversion Length Negative Only – 227 days
If we count only the days the curve is inverted during the same window as above, there have been an average of 227 days of inversion. One of the takeaways here may be that a temporary flip positive should not be interpreted as the all-clear signal. We can see a talking head on CNBC explaining why this time is different and the recent inversion can be discounted because the yield curve has righted itself.
Average Inversion – 0.16%
We were also surprised to see that the average inversion was just 0.16%. If the 2T is at 2.26%, the 10T would be at 2.10% – that doesn’t seem unreasonable. The takeaway here is that the inversion doesn’t have to be dramatic. Again, we will be cautious of any CNBC guru noting how the yield is inverted “just” 0.16% and how this time is different.
Average Max Inversion – 0.38%
Yep, the max inversion was just 0.38%. Again, if we keep the 2T at 2.26%, that means the 10T is at 1.88% (remember the tariff discussion from above). But if the Fed drives up expectations for future hikes and the 2T moves to 2.50%, the 10T would need to fall to just 2.12% to match the average max inversion.
Average Days Until Recession – 790 days
This one surprised us the most. From the first day of inversion to the start of the recession as defined by the NBER, more than two years pass! That means you’ve probably just spend the last 3 minutes reading a section devoted to a hypothetical inverted yield curve that would lead to a hypothetical recession more than two years later. I can’t give you that time back, sorry.
But maybe the takeaway again is that an inverted yield curve should not mean we are already in a recession, nor that it is imminent.
IF the yield curve inverts (and it very well may not), we will likely hear lots of commentary why this time is different. Maybe they will note how the inversion was just for a few days and has reversed course, so it probably doesn’t mean anything. Or maybe that the curve is “only” inverted a few basis points, which is normal for reason XYZ. Stocks may keep climbing. Job growth will continue.
But unlike Hope Hicks Michael Cohen Kellyanne Conway Jared Kushner Rick Gates Corey Lewandowski Michael Flynn Sean Spicer John Kelly George Papadopoulos Sarah Huckabee Sanders Paul Manafort Rob Porter Devin Nunes Jeff Sessions the stock market, the yield curve doesn’t lie. If it inverts, we’re headed for a recession – it’s probably just two years away.
This Week
Big data this week is CPI and PPI. While the Fed’s preferred measure of inflation is Core PCE, the markets certainly react to CPI/PPI – last month’s reports caused a spike in rates. We suspect the data will be a touch softer this month and still wonder if data can cause the 3.00% threshold on the 10T to break with the Stormy tariff cloud hanging over the market.