

This month’s CPI print may have just taken the worst case scenario for rate hikes off the table.
The headline number came in just below expectations at 8.5% versus the 8.7% expected. Core CPI, which strips out volatile food and energy prices that could be influenced by trading, also printed below expectations, coming in at 5.9% versus 6.1% expected.
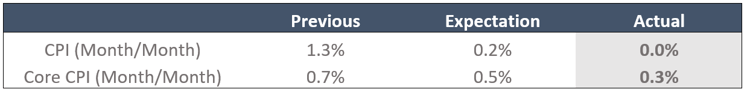
But what the market really cares about are the month over month numbers, which signals whether inflation is still accelerating. Both monthly prints for July came in below expectations, with CPI including food and energy showing a 0.0% change from the previous month.
Markets were already expecting the monthly numbers to sharply decline from the previous month, meaning a slowdown was already expected. Not only has inflation slowed way faster than expected, but at the fastest pace since April 2020 at the start of the pandemic. Inflation could have just peaked.
In response, the 10 year Treasury dropped sharply by 10bps. Meanwhile, the 2 year Treasury nosedived, falling 17bps as the market adjusts its expectations for rate hikes at the Fed’s September meeting.
Prior to the data, markets were pricing in a 73% chance of a 75bp rate hike at the next FOMC meeting. Markets are now pricing in just a 45% chance.
Yesterday’s forward curve shows SOFR peaking at 3.63% in April 2023. Today, SOFR’s only expected to run up to 3.50% before retracing.
If you’re working on an upcoming floating rate financing requiring a rate cap, traders will likely be pricing caps defensively this morning due to the pop in volatility. However, costs should begin to recede noticeably once the dust begins to settle.