

Last Week This Morning
- Basically nothing, right? Oh wait, maybe a thing or two..
- Former National Security Advisor General Michael Flynn pled guilty to lying to the FBI and is likely cooperating with Mueller’s investigation.
- 10yr Treasury dropped 10bps on an ABC report that Flynn’s testimony would directly implicate President Trump. ABC later retracted this erroneous report. Reversal coming?
- Tax cuts were passed (Yellen questioned the effectiveness on Wednesday)
- Consumer confidence hit its highest level since 2000
- Brexit negotiations hit a snag over Irish border
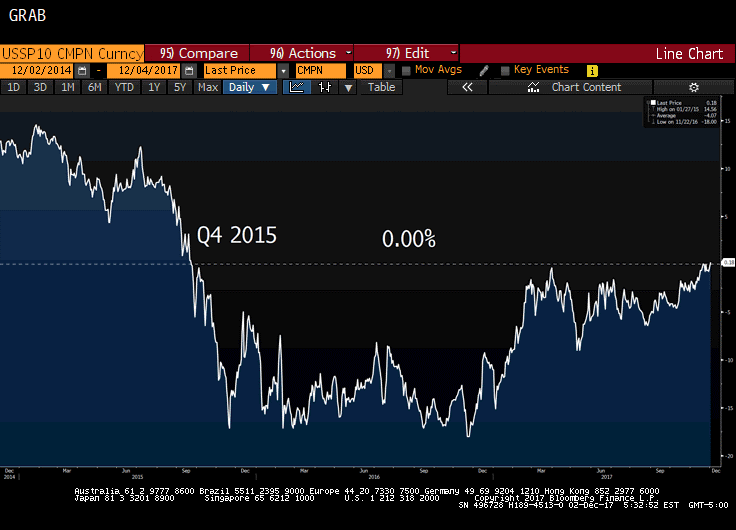
- 10 year swap spreads broke 0.00%, meaning 10 year swap rates are back above 10 year Treasury yields for the first time since late 2015.
- Core PCE, the Fed’s preferred measure of inflation, came in at 1.4%, slightly higher than the last two prints of 1.3% but still well below the 2.0% target.
- Q3 GDP came in at 3.3%, slightly higher than the forecasted 3.2%.
- Markets are pricing in a 94% probability of a 25bps hike and a 6% probability of a 50bps hike at the December 15th FOMC meeting.
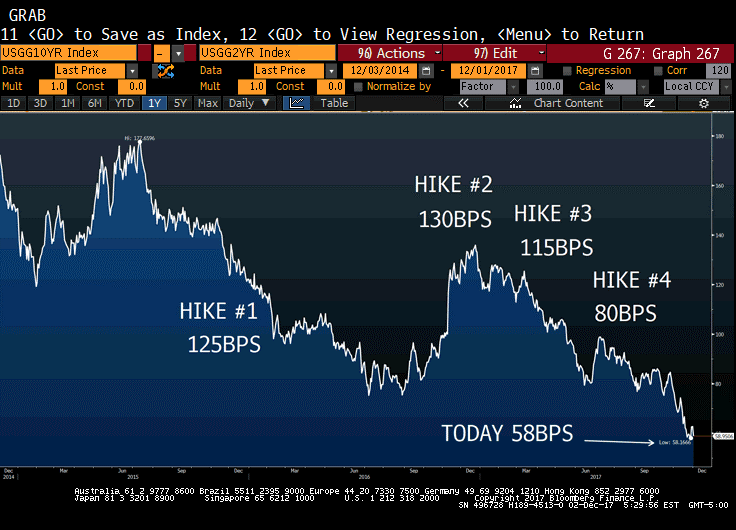
- Yield curve flattening trend continued, with the spread between the 10 year Treasury and the 2 year Treasury at just 0.58% – the flattest level in 10 years.
Rates
LIBOR continues its march higher and reset Friday at 1.38%, the highest level since December 2008. With markets pricing in a 100% probability of a hike on December 15th, it will likely keep pushing towards 1.50% by year end. Couple the tightening cycle with typical year end liquidity issues, and LIBOR could break 1.50% by the end of the month. The market has another hike priced in March.
The 10 year Treasury had jumped early in the week on news of progress on tax reform cuts and better than expected GDP. This was completely erased Friday on news that Flynn pled guilty to lying to the FBI and was cooperating with Mueller’s investigation. More importantly, ABC News reported that Flynn would directly implicate Trump. The fear of a Constitutional crisis threw rates into a nosedive and the 10yr Treasury dropped 10bps in a few minutes.
The ABC News report turned out to be erroneous (fake news!) and the 10yr rebounded 5bps to close out the week at 2.36%.
While tax cuts and strong economic data help contribute to the momentum of higher rates, the fear of Mueller’s investigation implicating the president’s inner circle are keeping a lid on the movement.
We can’t help but wonder if the value of Trump to the GOP is dropping daily. Once tax cuts become formally approved, how much do Ryan and McConnel need Trump going forward? They have tolerated him thus far for two reasons: 1. Fear of retribution from his base, 2. Fear of GOP agenda failing.
As odds of Trump’s involvement with Russia increase and the GOP’s use for Trump decrease, we could hit a tipping point where Republicans throw Trump to the wolves.
PredictIt has a 41% probability of Trump being impeached and the odds of Trump still being president at the end of 2018 at just 63%. Another betting site, Ladbrokes, has the same likelihood at 64%.
10 Year Treasury Volatility
Despite the recent oscillations, 10 year Treasury volatility remains incredibly low. Volatility has been artificially depressed with massive accommodation. As that accommodation is removed, volatility should increase. We should experience more days of +/- 10bps movement in 2018.
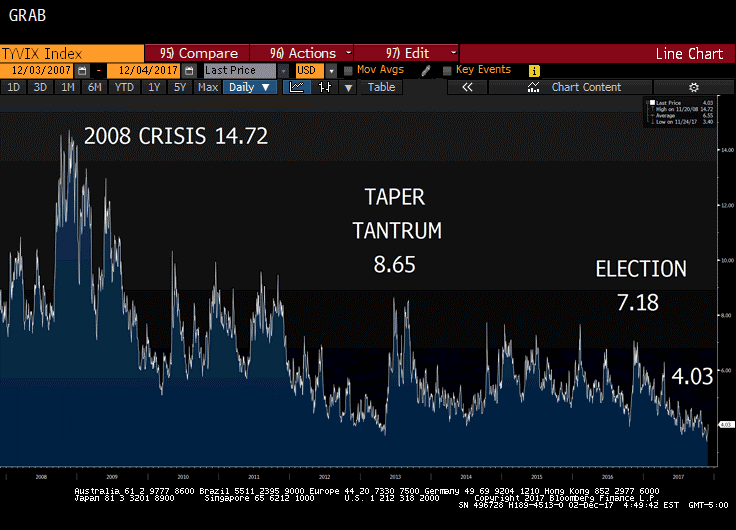
Source: Bloomberg Finance, LP
Core PCE
In addition to the flattening yield curve, low inflation (using the Fed’s preferred measure of Core PCE) could handcuff the FOMC from multiple rate hikes in 2018. While the Fed keeps claiming inflation should return to 2.0%, the fact is that it hasn’t.
The longer Core PCE remains depressed, the tougher it will be for the Fed to hike in 2018.
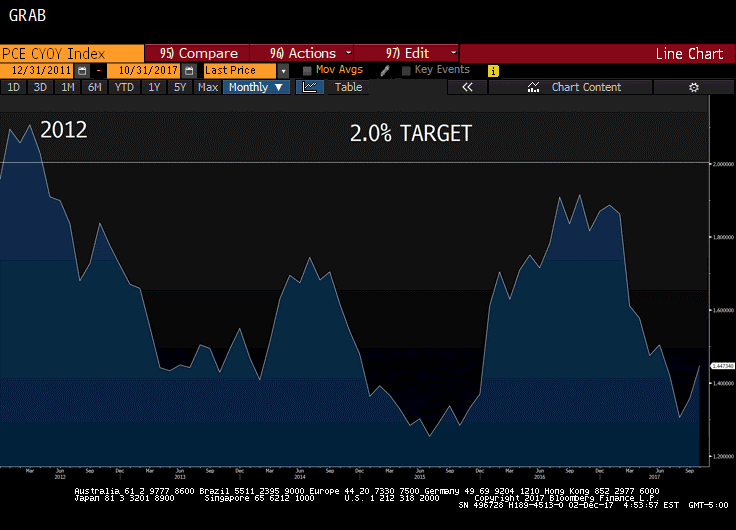
Source: Bloomberg Finance, LP
Furthermore, isn’t it possible that the rate hikes over the last two years are working? Here’s the same Core PCE graph over the last three years and illustrating the inflation trend vs rate hikes.
If Core PCE keeps climbing towards 2.00%, the Fed can keep hiking. But if inflation continues to stall, it will be difficult for the Fed to justify additional hikes.
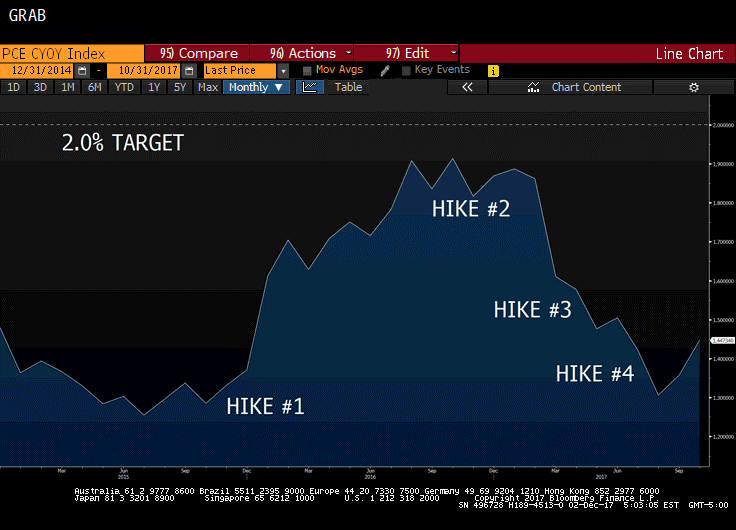
Source: Bloomberg Finance, LP
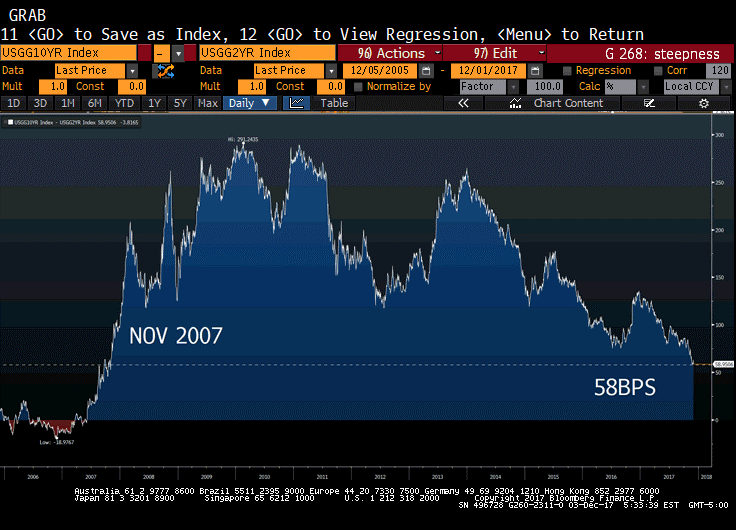
Flattening Yield Curve
We’ve been banging on this drum for nearly two years now as a primary reason why the Fed can’t hike aggressively even if they wanted to – the spread between the 10 year Treasury and the 2 year Treasury is the lowest in a decade.
The 2 year Treasury is a predictor for Fed Funds over the next two years. For example, with the 2 year Treasury at 1.77% today, it suggests the market expects Fed Funds to average 1.77% over the next two years. Assuming a hike in two weeks and a nice linear ascent over the next 24 months, that yield suggests the market is expecting one hike in 2018 (putting LIBOR at 1.75%) and one hike in 2019 (putting LIBOR at 2.00%), roughly averaging 1.77% over the next two years.
While the Fed has direct control over the 2 year part of the curve, it has far less control over the long end. If the 10yr Treasury refuses to climb while the Fed is hiking, the yield curve flattens. If an inverted yield curve precedes a recession, then it stands to reason a flattening yield curve is flashing warning signs, right?
Source: Bloomberg Finance, LP
Notice how the yield curve has flattened since the Fed started hiking in December 2015.
Hike #2 came after the election and the 10 year Treasury had spiked above 2.50%. Since then, however, the 10yr Treasury has refused to climb in lockstep with the 2 year Treasury and the curve, therefore, flattens.
The flatter the yield curve, the more discussions around a possible inversion.
Can the Fed keep hiking if the 10 year Treasury doesn’t climb?
Source: Bloomberg Finance, LP
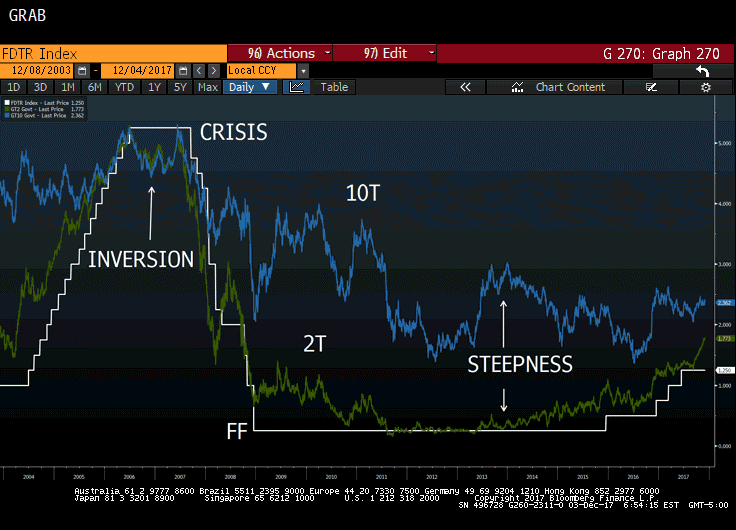
The last time the yield curve was this flat was November 2007, but rates were going in a different direction then.
In late 2007, the yield curve returned to a positive slope only because the FOMC was slashing Fed Funds faster than the long end of the curve could keep up. As the Fed drove the front end down, the yield curve steepened even though rates were falling.
In other words, front end rates were dropping faster than the long end of the curve. Therefore, comparing today’s flattening to Q4 2007 is a bit misleading.
Source: Bloomberg Finance, LP
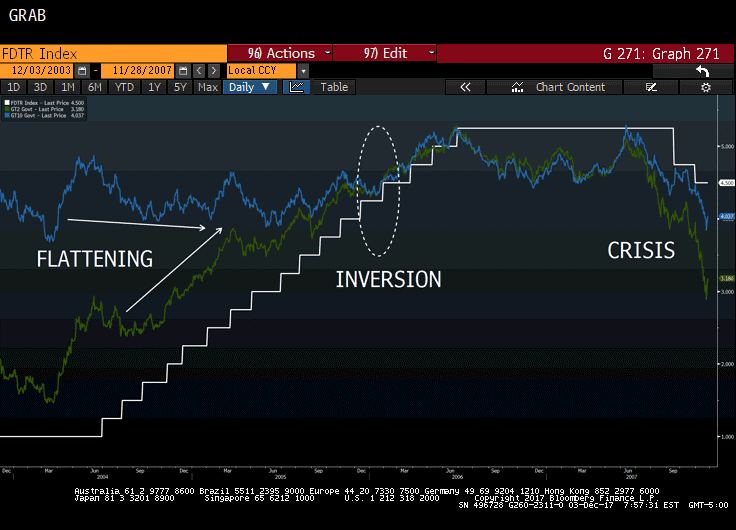
Today, the flattening is more akin to the 2004-2005 timeframe as the Fed hiked 25bps every meeting. This tightening pushed the 2 year Treasury higher, but the 10 year Treasury refused to play along and move higher with it.
This flattening played out in the two years leading up to the inversion in late 2005.
Sound familiar?
Source: Bloomberg Finance, LP
Can the Fed Steepen the Yield Curve?
As previously mentioned, the Fed struggles to exert control over the long end of the curve, but that doesn’t mean it has no control.
If the Fed wanted the 10 year Treasury at 5.00%, it could do so by actively selling its Treasury holdings. Unfortunately, the subsequent rate movement would not be a controlled one. Full blown panic would flood the market as the biggest holder of Treasurys became an active seller, and so the Fed may not be able to dictate whether the 10 year Treasury hits 4.00%, 5.00%, or 6.00%. It could become a runaway freight train.
That leads us to Passive Tightening, aka Reverse QE, aka Balance Sheet Normalization, all terms to describe the current plan of simply not reinvesting maturing proceeds. As discussed in previous newsletters, the general consensus is that the prescribed pace should result in upward pressure on yields to the tune of 0.25% per year.
The Fed could also announce another Operation Twist, where the intent is to twist the shape of the yield curve. You may recall this term from 2011 when the twist was intended to push down long end rates and rate short term rates. The opposite can be done, with active selling of long ends bonds, but again the risk is the market presses a panic sell button.
Because the Fed has better control over the front end of the curve, we think it will focus here.
What if the Fed hikes in December and couples it with a statement that decreases odds for hikes in 2018? What if it does something more dramatic and promises no rate hikes for two years? The 2 year Treasury would drop back down to 1.50% and the yield curve would steepen by 0.25% even if the 10 year Treasury doesn’t budge.
To be clear, that’s not happening December 15th. This is likely Yellen’s last hike and she’s not going to make a commitment like that right before she hands off the Fed to Powell. But you get the idea. Powell may very well soothe markets in Q1 2018 by reassuring a very gradual pace of hikes. While the current FOMC projections suggest three hikes in 2018, the Fed could slowly back that down to two or even one hike and steepen the curve.
The yield curve could also steepen if inflation expectations start rising while the Fed remains dovish.
If the 10 year Treasury climbs to 3.00%, the Fed has plenty of room to keep hiking. But if the 10 year Treasury stays below 2.50%, the Fed will find it increasingly challenging to keep hiking.
We may very well be nearing the end of the tightening cycle, with the Fed switching its focus to the long end of the curve and waiting for the 10 year Treasury to move towards 3.00% before hiking anymore.
10 Year Swap Spreads
10 year swap spreads flipped negative in late 2015. The previous definition of swap spreads was the hypothetical credit spreads of a AA-financial institution vs the US government. But no one realistically expected a AA financial institution that had been bailed out by the government to suddenly have better credit quality than the government.
Source: Bloomberg Finance, LP
We wrote the Not Very Definitive Guide to Negative Swap Spreads. Here’s a brief recap of what contributed to negative swap spreads:
- Dodd-Frank – regulations reduced risk
- Quarter end selling – everyone enters into received fixed swaps at quarter end
- Treasury sell off – bonds are bought and sold separately from swaps, so as Treasury yields climb, the swap curve may hold steady and the spread compress (or go negative)
- Corporate issuance – massive fixed rate bond issuance swapped back to floating, meaning you receive fixed (just like in #2) and it exerts downward pressure on swap spreads
We wrote, “Not one trader I spoke with thought this was a short-term aberration.” That was two years ago. Last week, 10 year swap spreads flipped positive, albeit just barely. We will be releasing a more in-depth analysis, but for now the leading culprit appears to be less regulation.
This Week
Normally, Friday’s job report would be the headliner, but not with taxes, Russian investigation, and the next week’s FOMC meeting in the spotlight. We might see some intraday gyrations, but it’s tough to envision NFP or the unemployment rate causing the range to break.
10 year Treasury high side resistance
2.42%-ish
2.50%-ish
10 year Treasury low side support
2.31%-ish
2.25%-ish
Fed speakers should be mostly quiet ahead of next week’s FOMC meeting.