How Do Floating Rates Behave In a Tightening Cycle?
Last week, we discussed why the best time to lock in a fixed rate is right before the Fed starts hiking. This week, we will tackle how rates and caps behave during tightening cycles.
Expectations have been a runaway freight train for the last three months. On December 1, 2021, there was less than a 1% chance of a rate hike in March. Today, there are growing calls for 0.75% (forget 0.50%) and intra-meeting hikes.
Deutsche and Citi are calling for a 50bps hike in March. Goldman has again revised their forecasts higher, calling for 7 hikes this year. Bank of America agrees with the 7 hikes but is also calling for an ultimate landing spot of 2.75%-3.00% for floating rates as well as a $1T reduction in the Fed’s balance sheet by year end.
The 2 Year Treasury, the part of the yield curve that is most controlled by FOMC policy, jumped 0.25% on Thursday, the biggest one day move since 2009. A month ago, I was saying it was too low at 0.90% and to expect it to climb to 1.25%, but it blew right past that to 1.54%. Not surprisingly, cap prices have tripled.
1 month LIBOR is up to 0.19% as we hit the one-month window prior to the next Fed meeting.
This is insanity. What’s so shocking is everyone knew in November that inflation would be climbing through at least January. If these numbers were expected, why the move? Why are we suddenly talking about 2.00% of hikes this year?
The odds of a recession in the next 12 months stand at about 5%-12% depending on which measure you use. But what about 2023? If Fed Funds is 2.0% and the Fed has shrunk the balance sheet by $1T…the odds will be higher unless growth is gangbusters.
With that as a backdrop, we thought this would be a good time to examine how floating rates and interest rate caps typically behave during tightening cycles.
What Happens to Floating Rates During a Tightening Cycle?
We are going to use “floating rates” to approximate Fed Funds, LIBOR, SOFR, etc. They are largely interchangeable since they are each primarily controlled by FOMC monetary policy.
If you’ve been reading the newsletter for any amount of time, you are familiar with our hairy graph. It provides two critical takeaways:
- Markets almost always overestimate the path of floating rates
- But right before a tightening cycle, markets underestimate the path of floating rates a. Red boxes included to highlight right before tightening cycles
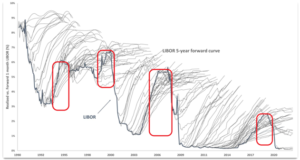
Floating Key Takeaway #1 – the market is probably underestimating the path of floating rates
Well, it was. Things have changed so quickly since I began pulling this together a few weeks ago that I’m not sure it is today.
If history is a guide, markets had probably underestimated how high floating rates will get in the near term. Two weeks ago, projections put floating rates around 1.00% in a year, and 1.75% in two years. Today those numbers are about 0.25%-0.50% higher.
Generally speaking, the market typically misses by about one to two hikes over the first year, two to three hikes by the end of year two. It’s probably not a coincidence that this is about the amount that rates have jumped in the last two weeks.

There’s a chance the market has already quickly corrected and is now accurately pricing in hikes.
Floating Key Takeaway #2 – Tightening cycles don’t last very long
From the first hike to the first cut has never been more than 3.2 years.
If the Fed hikes in March and ultimately hasn’t cut rates by June 2025, it will literally be the first time in history.
The longest time between first hike and first cut was June 2004 to Aug 2007.
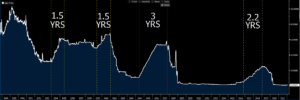
Source: Bloomberg Finance, LP
As floating rates start climbing, be mindful of floors. They tend to be throwaway negotiating items because they seem to have no relevance – rates are climbing, why would I care about a floor? This is less important today for a 3 year deal but will become increasingly important the further we move into the tightening cycle.
When the Fed hikes next month, the clock starts ticking towards the first rate cut.
Key Floating Rate Takeaway #3 – We always forget to price in the inevitable downturn
A year from now, there’s a good chance floating rates are higher than we expect. Maybe 2.00%? 2.50%? 3.00%?
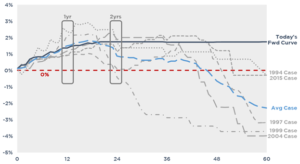
But look at the graph below from previous cycles. Within two years, there’s a good chance floating rates are already trending lower. The y-axis starts with the first hike of each tightening cycle. Yes, rates will go up. But what goes up must come back down.
How Do Caps Behave in a Tightening Cycle
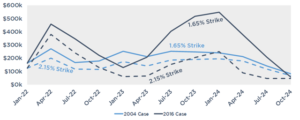
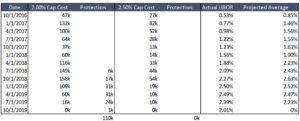
We looked at cap prices during the last tightening cycle. We are ignoring the Dec ’15 hike for our purposes, since the first hike of the real tightening cycle was Dec ’16. The Fed will be hiking next month, so we started our analysis a couple months before the hike to mimic today. The grid below assumes a $25mm cap at either 2.00% or 2.50%.
An overly simplistic explanation of how caps behaved in the last tightening cycle:
- Prices jumped once the market realized it was underestimating
- Prices dropped as the time value bled off and the market waited for rates to catch up
- Prices jumped again once the market realized the Fed was going to keep hiking
- Prices dropped as maturity neared
Practical Takeaway
If you’ve tried to purchase a cap recently, the price has been rising unabated for months. Can the last cycle tell us anything?
There appears to be a crossroads during the first year of the hikes. Rate expectations hold steady long enough for falling time value to really push the cost down.
But at the start of year two, prices jump again. There’s a chance that cap prices will look more attractive later this year before they start climbing again. That may be a good time to consider buying a cap.
Interestingly enough, the cap with a slightly higher strike experienced far less pricing volatility even though expectations suggested it would come into play. This is particularly true as the remaining term ran off.
2004 Cycle
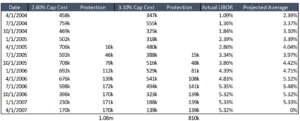
This is the one that keeps borrowers up at night. When the Fed began hiking, the market thought LIBOR would average 2.39% over the subsequent three years, but it ended up averaging 3.50%.
Cap prices spiked and stayed elevated. They also provided far more protection than they did in the 2016 cycle.
Practical Takeaway
If you think (or are at least concerned about) how this cycle will be different than the last cycle, this is Exhibit A for buying a longer term, lower strike cap. Even if you don’t get your money back completely, caps bought during this cycle provided substantial payout.
Bottom Line
The recent surge in pricing has been painful to say the least. In the last two cycles, there was an opportunity to buy a cap 6-12 months into the tightening cycle at a lower cost than at the start of the tightening cycle.
Floating interest rates climbed during this time, but not to the point where the caps were in the money anyway.
