

Well at least rates didn’t go up, right?
Last Week This Morning
-
10T: 4.43%
-
2T: 3.99%
-
SOFR: 3.62%
-
Term SOFR: 3.62%
-
Durable Goods Orders: 7.9% vs 4.0% expected
-
GDP: 1.6% vs 2.0% expected• PCE mostly as expected
-
Fed Speeches:
-
Bowman: “Reacting to temporarily elevated energy price inflation would add unwarranted policy restraint, weighing unnecessarily on economic activity and labor market conditions.”
-
Kashkari: “I am focusing heavily on inflation. I’m not ignoring at all the labor market. We need to pay attention to both sides, but the labor market is in decent shape right now, while inflation is simply much too high.”
-
Schmid: “With inflation running above the Fed’s 2 per cent definition of price stability fo rover five years, now is not the time to let down our guard.”
-
How Long Before Oil and Rates Might Come Back Down?
Inflation is up considerably since last month, but matched consensus expectations. The market exhaled a touch. Just remember – core inflation readings peak several months after the headline numbers. I expect to see headlines about stubborn/pesky core inflation once we are on the far side of this inflation burst, but that’s how it works.
Last week I did a deep dive into the only other times when oil jumped more than 50% in a month. This week, I want to examine how quickly oil/rates came back down and what it means for this cycle.
I’m falling in love with Claude’s ability to create interactive pages. Here’s one we put together comparing those three occasions: Oil Shocks - Interactive. . Don’t worry, I probably wouldn’t click on it either, so I’ll include the typical screenshots below.
I’m going to focus on the 1990 Gulf War, which I believe is the best comparison to the Iran situation. Don’t worry, you can clean it up by clicking on the buttons at the bottom.
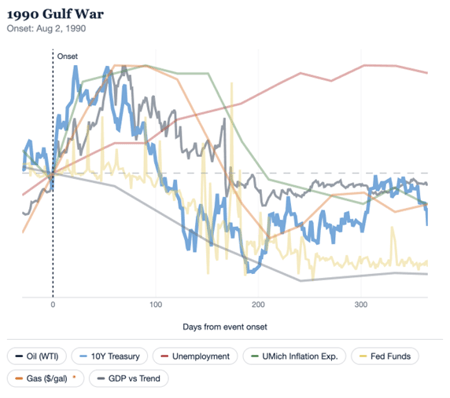
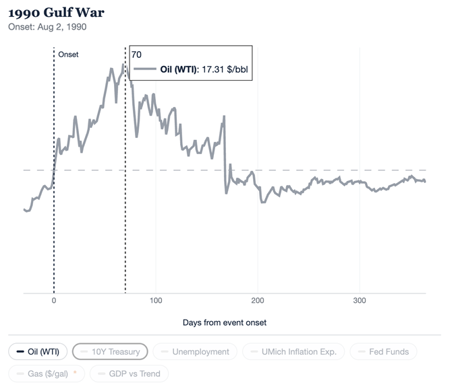
Oil was back below the starting point on Day 170. That would be August 17th this year. Here’s just oil
As for the 10 Year Treasury, it peaked 53 days after the initial shock – up 65bps.
It peaked (hopefully) 78 days after the first attack on Iran - up 66bps. History doesn’t repeat itself…
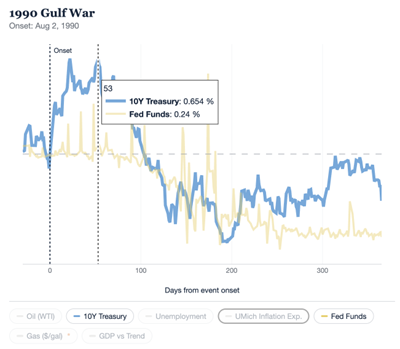
Interestingly enough, it took the same amount of time to fully retrace and fall back below the starting point. It has been 92 days since the first attack on Iran. It will be early September when that same amount of time passes again.
To recap, how long did it take to fall back below the starting point of the shock?
-
Oil took 87 days
-
Rates took 92 days
Maybe by the end of summer, we will have lower rates.
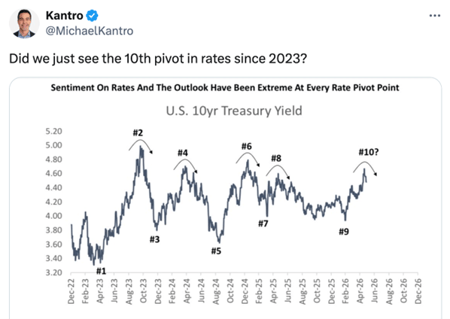
Otherwise, we are about to have another election on inflation and Trump doesn’t want that. I suspect we will conveniently reach a resolution soon. Hope springs eternal
.Chief Investment Strategist at Piper Sandler, Michael Kantro, gave brokers some hope as we head into the summer!
The Week Ahead
Finally something other than oil and inflation – jobs! Remember, last month saw a much stronger than expected 115k job gain. I’m not watching that bogus number as much as the Unemployment Rate. It’s been trading in a very tight band and sits at 4.3%.
Jobs are the only reason the economy has hung in there so far. I continue to believe if we start seeing layoffs, the economy is going to roll over sharply. In case you haven’t seen it, the Brookings Institute is doing a really good series on affordability and “why US households struggle to make ends meet.” The WSJ had a piece about credit card delinquencies hitting new highs (cc delinquency).
People with jobs are struggling.
Imagine what happens if they lose those jobs?