Our quarterly webinar is this week. I once again chickened out and scheduled it for the day after the FOMC meeting. This makes it easier to claim they did exactly what I expected them to do.
Speaking of chickening out, word on the street is our biggest competitor, <REDACTED>, recently announced their own webinar…. also on Thursday…. but two hours before ours. Interesting. It also means they are about to learn that start time is brutal for west coast clients…just like we learned a year ago after our first webinar. Adorable.
Before the days of binge watching, TV studios would schedule weaker shows to start right before or after strong shows. I thought it was called the Coattail Effect, because, you know, riding someone’s coattails. But this weekend I learned the real name is Hammocking. As in, Tree… Hammock… Tree. Strong… Needs Help… Strong.
One classic example is Seinfeld/Caroline in the City/Friends.
Strong… Needs Help… Strong.
Another is The Cosby Show/A Different World/Cheers.
It’s a thing for a reason – it works. Will & Grace was a successful hit out of the Must See TV lineup. Maybe <REDACTED> will be the breakout hit of the season. Best of luck to them. I just hope ours is strong enough to carry them…
Just remember…
There’s a lot of Caroline in the Citys. There’s only one Seinfeld.
(Separately, while Googling images of hammocks, I stumbled across an actual photo of a broker reminiscing about transactions. Those were the days.)

Last Week This Morning
- 10 Year Treasury at 4.33%
o German bund at 2.68%
- 2 Year Treasury at 5.04%
- SOFR at 5.30%
- Term SOFR at 5.33%
- Lots of inflation data
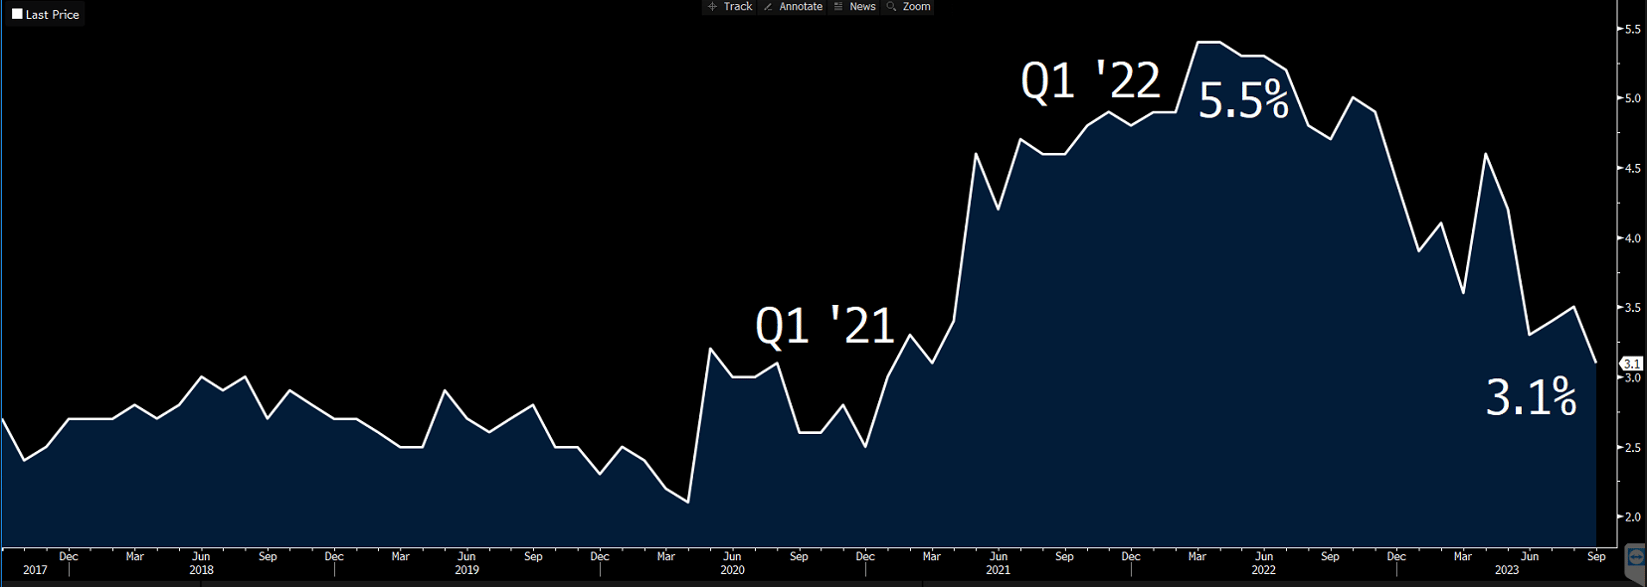
- Retail Sales MoM printed at 0.6% versus 0.1%
- NY Empire State Manufacturing Index printed at 1.9 versus -10
- U of Mich Sentiment printed at 67.7 versus 69.0
- Nas turned 50 this weekend, so consider that intro an homage to Ether
FOMC Meeting - Wednesday
Obviously, the Fed isn’t hiking this week. Remember – if market odds of a decision exceed 60% and the Fed thinks the market is wrong, they start sending signals. Odds of a pause stand at 98%, so there you have it.
Odds of a hike in November are down to 28%, which feels about right to me. I don’t think the Fed knows yet whether it will hike, but will have plenty of data between now and then to decide.
This week’s meeting won’t be a total snoozefest, however, because we get the updated Summary of Economic Projections, aka SEP. These are the anonymized forecast of Fed Funds, inflation, GDP, and unemployment.
Expect a big shift higher in GDP from 1% to 2%-ish, and a drop in unemployment from 4.1% to 3.9%-ish.
The SEPs will also show where the collective minds of the Fed are with rates in 2024. Cuts will just keep getting pushed back, with the first cuts likely now in at least the second half of the year and maybe not until year end.
I don’t think the statement itself will reference the UAW strike or the potential government shut down on 10/1, but there will be questions about each. I don’t think either have much impact on this meeting, but could influence November if they drag on.
And after the Fed is done, we still have 5 of 10 of the biggest central banks meeting to end the week. Central banks are having their Lizzo summer.
Inflation Hammocking
I’m in it now. I have to see this analogy through, right? After all, you didn’t come here for PhD level analysis. The Army wasn’t big on letting us use hammocks, so let’s see if we can figure this out together.
Tree - Univ of Michigan 1 year forward inflation expectations
Big win! Lowest inflation expectations in over two years. Powell is definitely happy with this.
 Source: Bloomberg Finance, LP
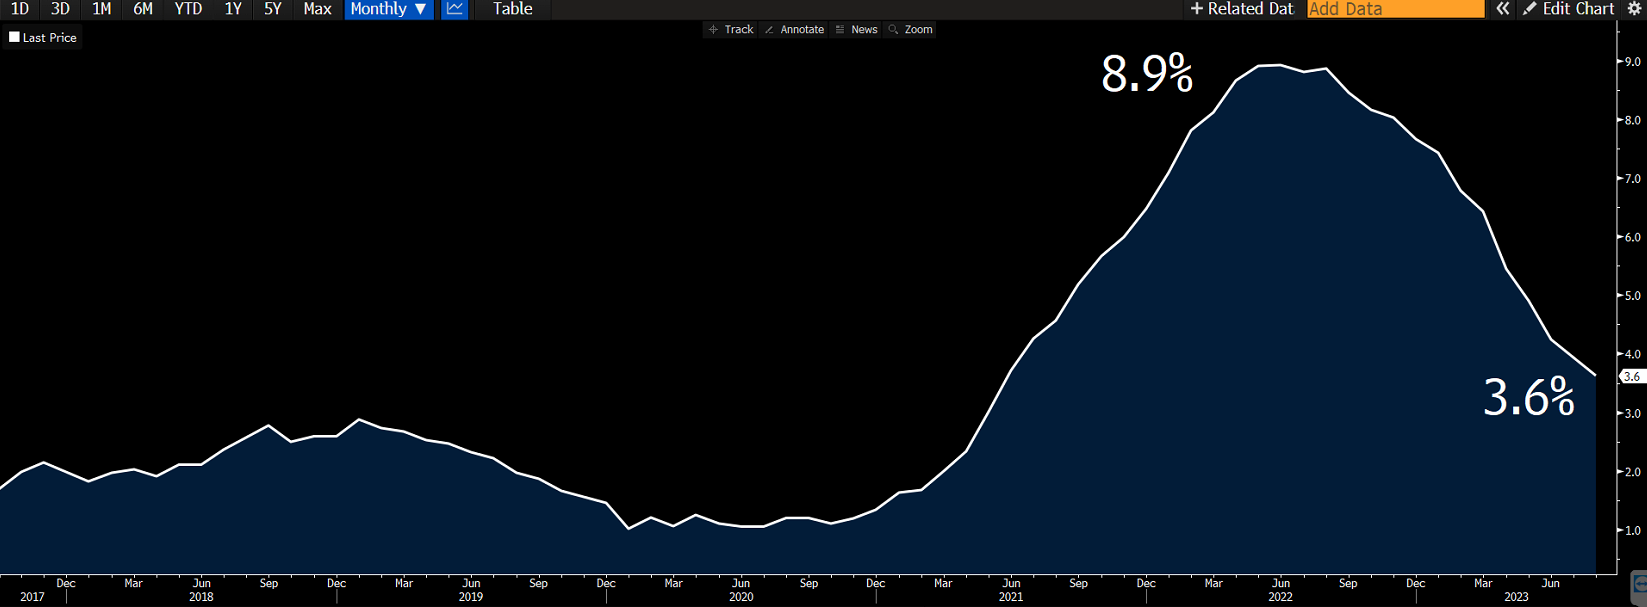
Hammock – Core CPI m/m
Unfortunately, Core CPI increased from 0.2% to 0.3%. Not good. It’s not terrible, but it’s not good. Markets are on edge about any signs of reacceleration, which is why m/m matters more than the annual headline numbers right now.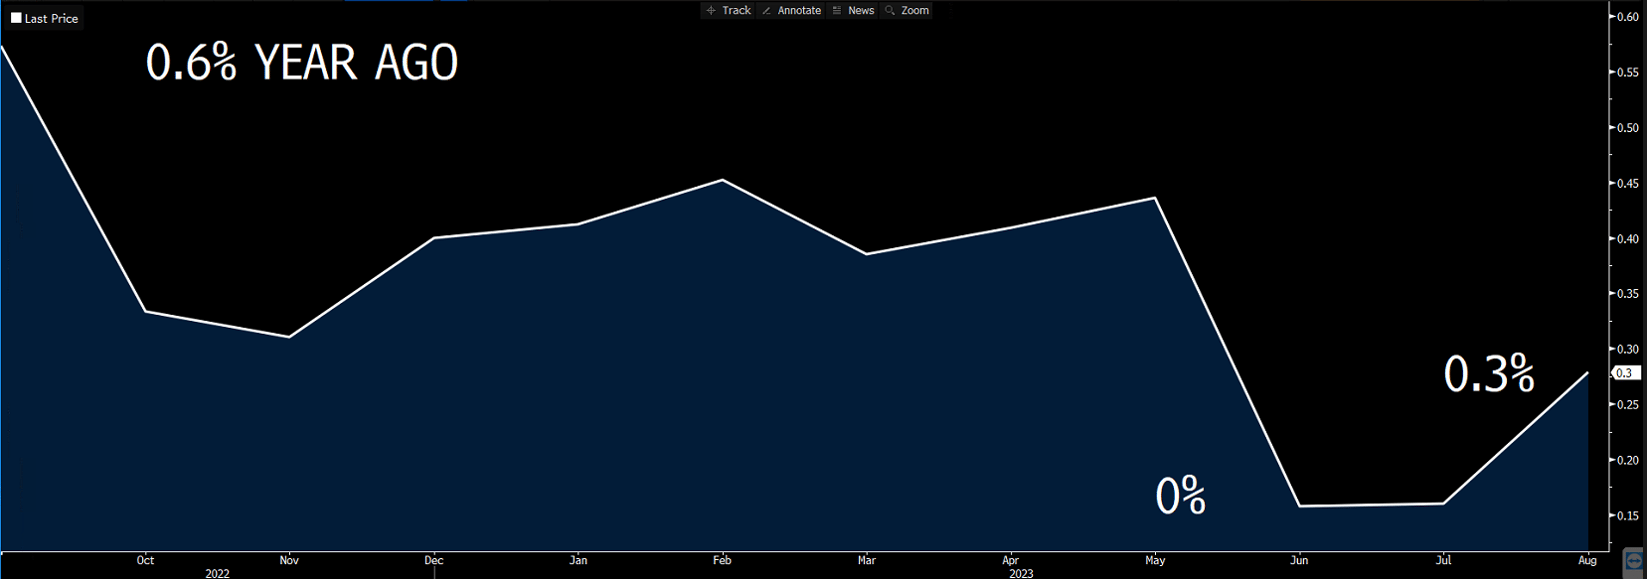 Source: Bloomberg Finance, LP
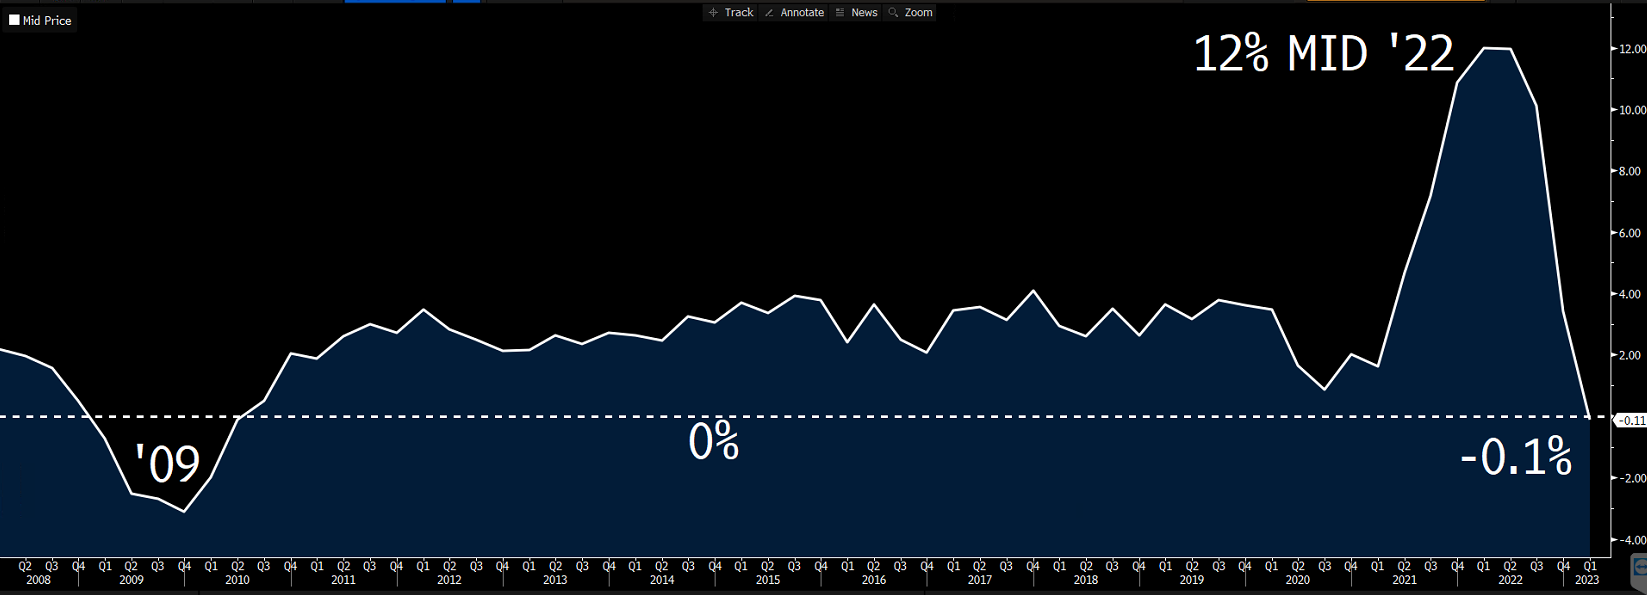
Tree – Cleveland Fed Rent Index
Sometimes you just let the graph do the talking…
 Source: Bloomberg Finance, LP
That was fun - let’s make another hammock together.
Tree - Cleveland Fed Inflation Nowcast
The Cleveland Fed has some awesome stuff on their site. The St Louis Fed has long been the gold standard of research and interactive data, but several of the other branches are really coming on strong.
Hammock – Supercore m/m
Damnit! Another monthly print showing signs of reacceleration. Supercore is the measure that strips out housing. Not great.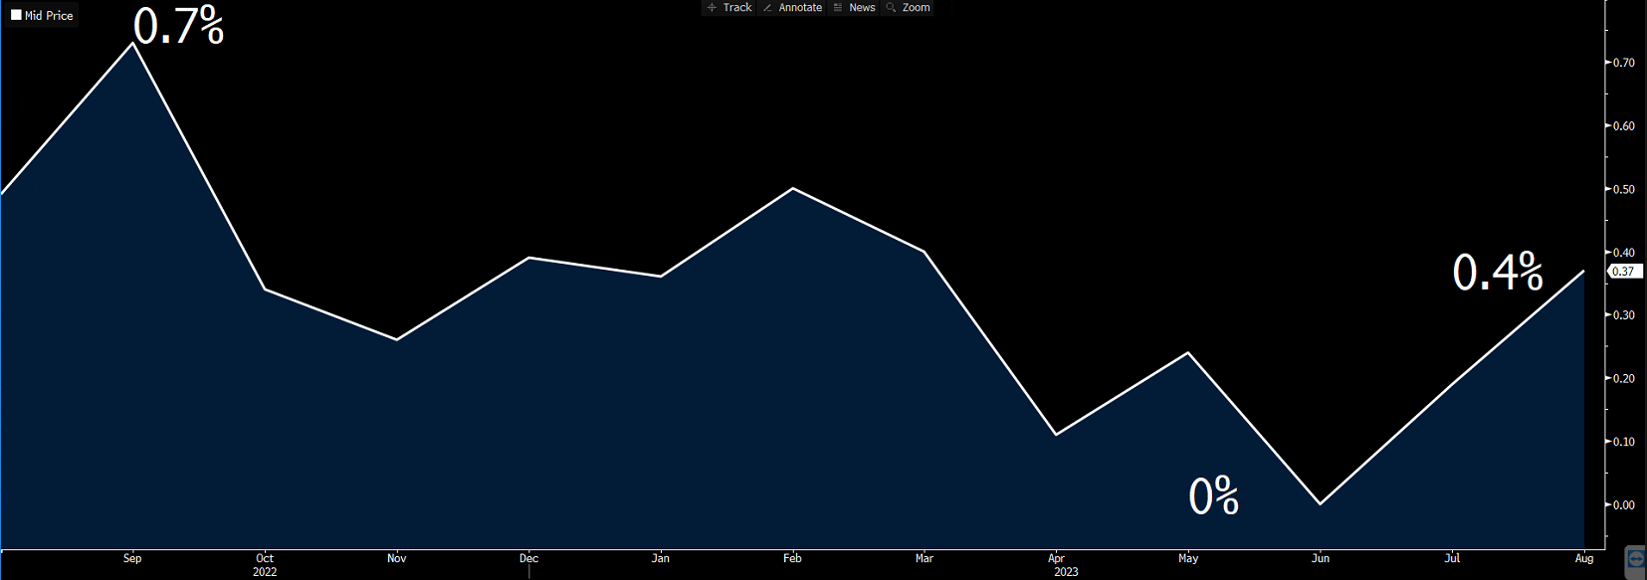 Source: Bloomberg Finance, LP
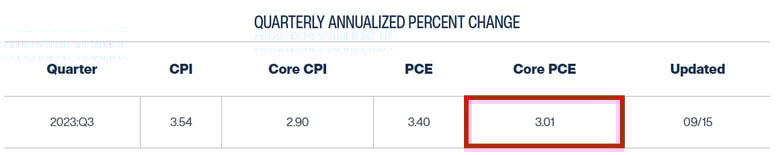
Tree – PPI Core
Have no fear – PPI Core is here! This one has a high correlation with supercore and generally leads by a few months. This suggests strongly Core PCE, the Fed’s preferred measure of inflation, is headed lower.
 Source: Bloomberg Finance, LP
Takeaway
Being the hammock is easier than being the tree.
Also, I’m not that worried about inflation reaccelerating... yet. Monthly numbers, just like annual numbers, can suffer from base effects. Oil surging is obviously going to impact inflation, but winning the war on inflation was never contingent on oil at $70/barrel. Fed Funds north of 5% will slow the economy. Period.
While Powell might be pining for the days when he can relax in a hammock with a good book, this mixed data is a good reminder why he will keep talking tough for the foreseeable future.
10 Year Treasury
One of the biggest reasons for the surge in rates is the result of everyone finally believing in higher for longer. It’s not just us, either. As our rates rise (and are not expected to fall), the dollar moves up with them. Foreign central banks have to deal with currency weakness relative to the strengthening dollar.
One of the best ways to prop up your currency is to buy it. Demand drives up price. But an even better way is to sell assets in the currency you are weak against. And then use those proceeds to buy your own currency.
This seesaw effect is what is happening right now. Foreign central banks are selling Treasury holdings to buy their own currency. This simultaneously weakens the dollar while increasing the value of their own currency.
It also pushes up our Treasury yields.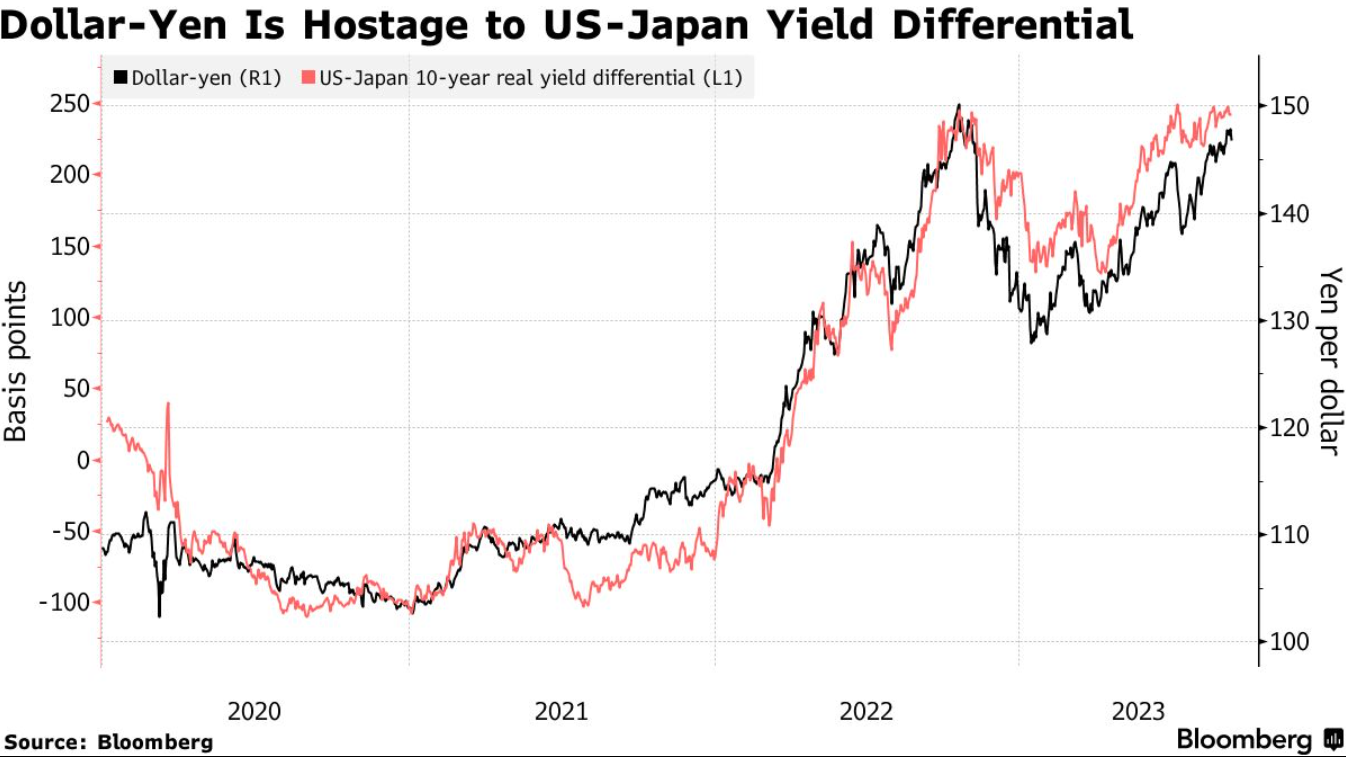
Yes, a weaker currency helps exports, but at the expense of driving up energy and food imports. And guess what everyone is laser focused on right now?
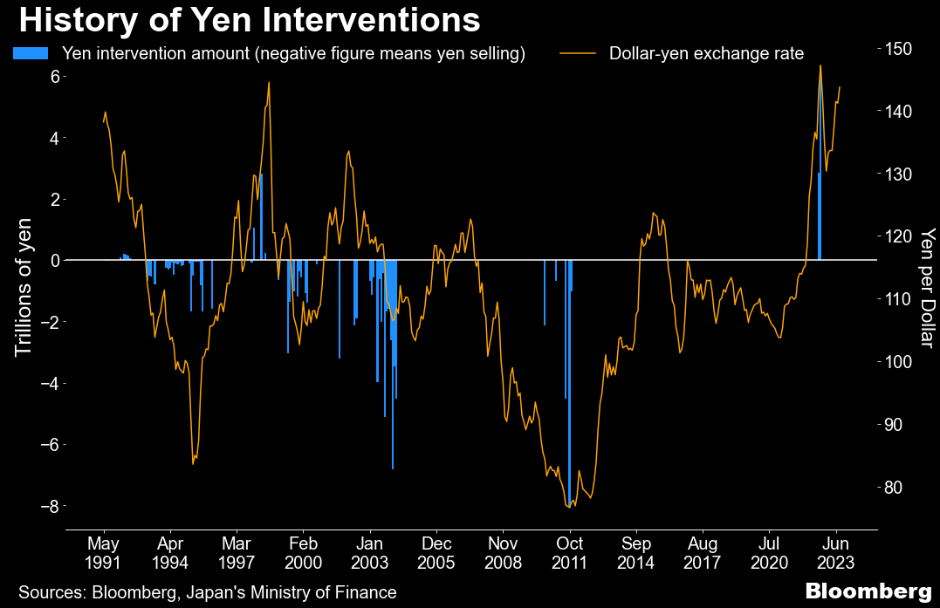
This suggests countries like Japan will intervene to a certain extent, but they won’t seek out parity. They just want to find a nice happy medium. Japan has a long history of interventions and we are in the midst of one of the most aggressive buying cycles in the last 30 years.
The key level on the 10T is 4.35%. If that breaks, we could be off to the races just like we were after breaking 3.92%.
Week Ahead
Not a ton of data to worry about, so let’s force the analogy one last time.
<REDACTED> reading the slides from our last webinar for ideas. You can tell it’s ours because it’s fit for consumption by a fourth grader.
Jay Money explaining to me why we need to wait for the sunset to use the stars to navigate.

And finally, the Real Boss at Pensford after we wrap up Thursday.
No newsletter next week because:
1. We will have just spent an hour together at Thursday’s webinar and I can only take so much of you guys
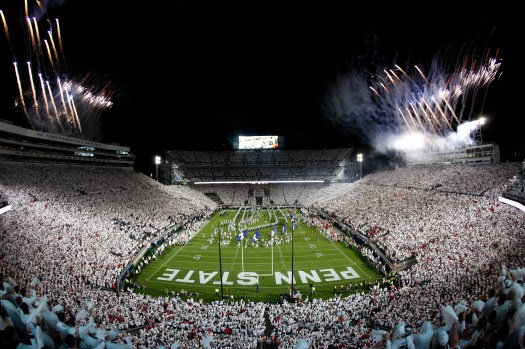
2. We’re headed to Happy Valley for our first White Out game since the 2020 game was cancelled