

Last Week This Morning
- 10 Year Treasury plunged to its lowest yield since the election, closing the week at 1.87%
- German bund down again to -0.50%
- German 30yr went negative for the first time ever before closing out Friday at 0.00%
- Japan 10yr down slightly to -0.16%
- German bund down again to -0.50%
- 2 Year Treasury trended slowly lower to 1.74%
- LIBOR at 2.24% and SOFR at 2.19%
- The Fed cut rates for the first time in 11 years
- Trump announced tariffs on the remaining $300B in Chinese imports
- Negative yielding investment grade debt (sovereign/corp) now exceeds $14T
- Core PCE came in at 1.6%, well below Fed’s target of 2.0%
- Chicago PMI (manufacturing) came in at 44.4, well below the contraction threshold of 50
- Dems seem willing to let anyone with a pulse stand behind a podium and explain why they deserve to be President
- China seems willing to wait until next year to negotiate when Trump may be willing to make concessions ahead of the election… or just to see who wins
- I am sure the GOP will be equally as comfortable with China interfering with US elections to help Biden win as they have been with Russia helping Trump
Jobs Report
The economy added 164k jobs last month, right on top of expectations. This is effectively the breakeven run rate to keep the unemployment rate constant.
- Unemployment rate inched slightly higher to 3.7%, mostly because the participation rate ticked up
- Wage growth rose at 0.3% m/m, while the annual increase is 3.2%
- Average hours worked slid to their lowest level in two years
While the headlines numbers are reasonably strong (and certainly not recessionary), the market is forward looking. Risks to the outlook are driving fear in markets right now, not current conditions. It’s tough for the market to focus on a jobs report when Trump is announcing tariffs on the remaining balance of Chinese imports. Nothing about this report will move rates much given everything else that is going on.
Budget Deal
Holy schnikes, Congress did something productive last week! Maybe they wanted to avoid another extended shutdown as election talk heats up. Self-preservation is a very real motivator! They set aside their differences and passed a budget deal that eliminates spending caps, suspends the debt ceiling through July 2021, and increases spending allocations for another 24 months.
Federal spending is still on pace to be about half of last year’s spending, and we are seeing the impact of that on slowing GDP.
While this removes fiscal contraction and a government shutdown off the table, it’s unlikely to be enough to send warm and fuzzies through the market.
FOMC Rate Decision
The Fed cut rates for the first time since the financial crisis and announced an early end to balance sheet normalization. The announcement reiterated that muted inflation and persistent uncertainties would lead the Fed to “act as appropriate to sustain the expansion.”
The 10 Year Treasury plunged. Remember when I said the 10 Year Treasury could actually move higher if the Fed sent dovish signals? They didn’t. So, rates fell. The market is disappointed spooked that the Fed isn’t responding aggressively enough.
Powell characterized the rate cut as a mid-cycle adjustment rather than the beginning of a loosening cycle. This suggests the Fed plans on cutting one more time this year with no promise of more cuts next year (which the market wanted). He also said the rate cut “is the right move for today,” potentially suggesting there are no more cuts guaranteed.
I still expect another cut in September. Even my grandmother in central PA knows the Fed has never cut just 25bps. Powell would have spent more time signaling the Fed may not cut again this year if that’s what he thought. He didn’t. That means we should expect at least one more cut. Anything beyond that is undetermined right now. And if I’m wrong, there will be a lot of Fed signals over the next few weeks so the market can adjust expectations.
There were two notable changes to the statement:
- The statement cited “global developments” as a risk to the outlook. Since the eurozone is a mess and tensions with China don’t appear to be ending anytime soon, this came across as dovish.
- The Committee will “continue to monitor the implications of incoming information as it contemplates the future path of the target range for the federal funds rate.” This sounds an awful lot like data-dependence and that the Fed hasn’t made up its mind on the ultimate target landing spot.
The Fed is flirting with an inverted yield curve again (2/10’s). In fact, I was surprised it didn’t invert last week. Powell is sending signals that there may be fewer cuts than expected, which should keep the 2T elevated. If the 2T is elevated, and the 10T represents a flight to safety and moves lower, we could have an inverted yield curve. The only thing that prevented an inverted yield curve last week was the market’s refusal to take Powell at his word.
Rates – Fed Inaction Pushes Down Rates
I think the market may be overreacting to the lack of dovish tone in Powell’s press conference. It wanted a clear road map for 0.75% in cuts over the next 6-9 months, and it didn’t get that. But an insurance cut just six months after the last hike is a big reversal and Powell probably doesn’t want to overreact to cooling data and event risks.
Rates fell across the curve. I was more surprised with how much the 2 Year Treasury fell because it’s supposed to represent the path of LIBOR over the next two years. If Powell said, “We are on hold for two years”, then the 2T should be somewhere between 2.00% – 2.25%.
If the FOMC statement suggests one more cut, that means the 2T should be trading between 1.75% – 2.00%. Before the meeting, it was trading around 1.85%, just about right. If the market believed Powell’s view would ultimately prove correct, the 2T should have stayed flat. But after Powell’s comments, it actually fell into the low 1.70%’s.
While that’s still the low end of the range, it really suggests the market believes Powell’s inaction will ultimately result in more cuts.
That’s a key concept to understand what is driving markets right now. Aggressive intervention, whether that’s actual cuts or forward guidance, will be received warmly by the market. It actually encourages risk-taking because the Fed isn’t tone deaf. Alternatively, inaction spooks markets because it means the Fed will be slow to aid the economy.
Same concept with the 10 Year Treasury, which plunged into the mid-1.80%’s. If the Fed is slow to move, then it will be more likely to push us into a recession. Flight to safety. 10 year rates fall.
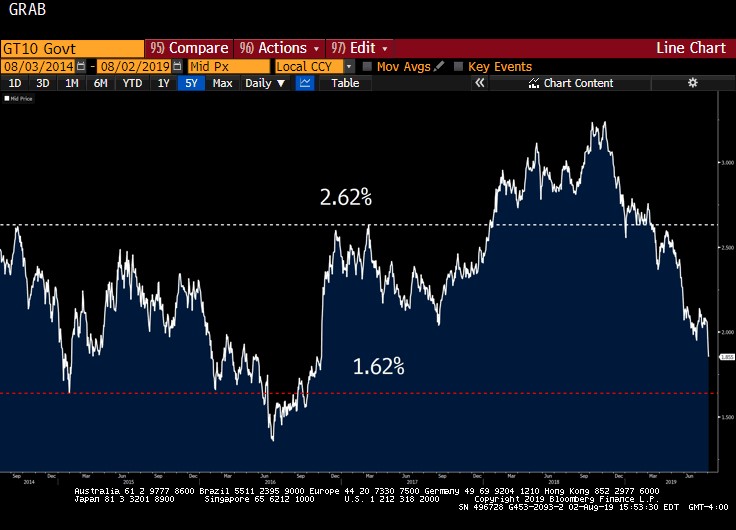
The new floor on the 10 Year Treasury is around 1.62%. Second half GDP and inflation will be the primary drivers of where the 10T moves. Fear has driven yields lower, but if those fears fail to materialize the 10T could rebound.
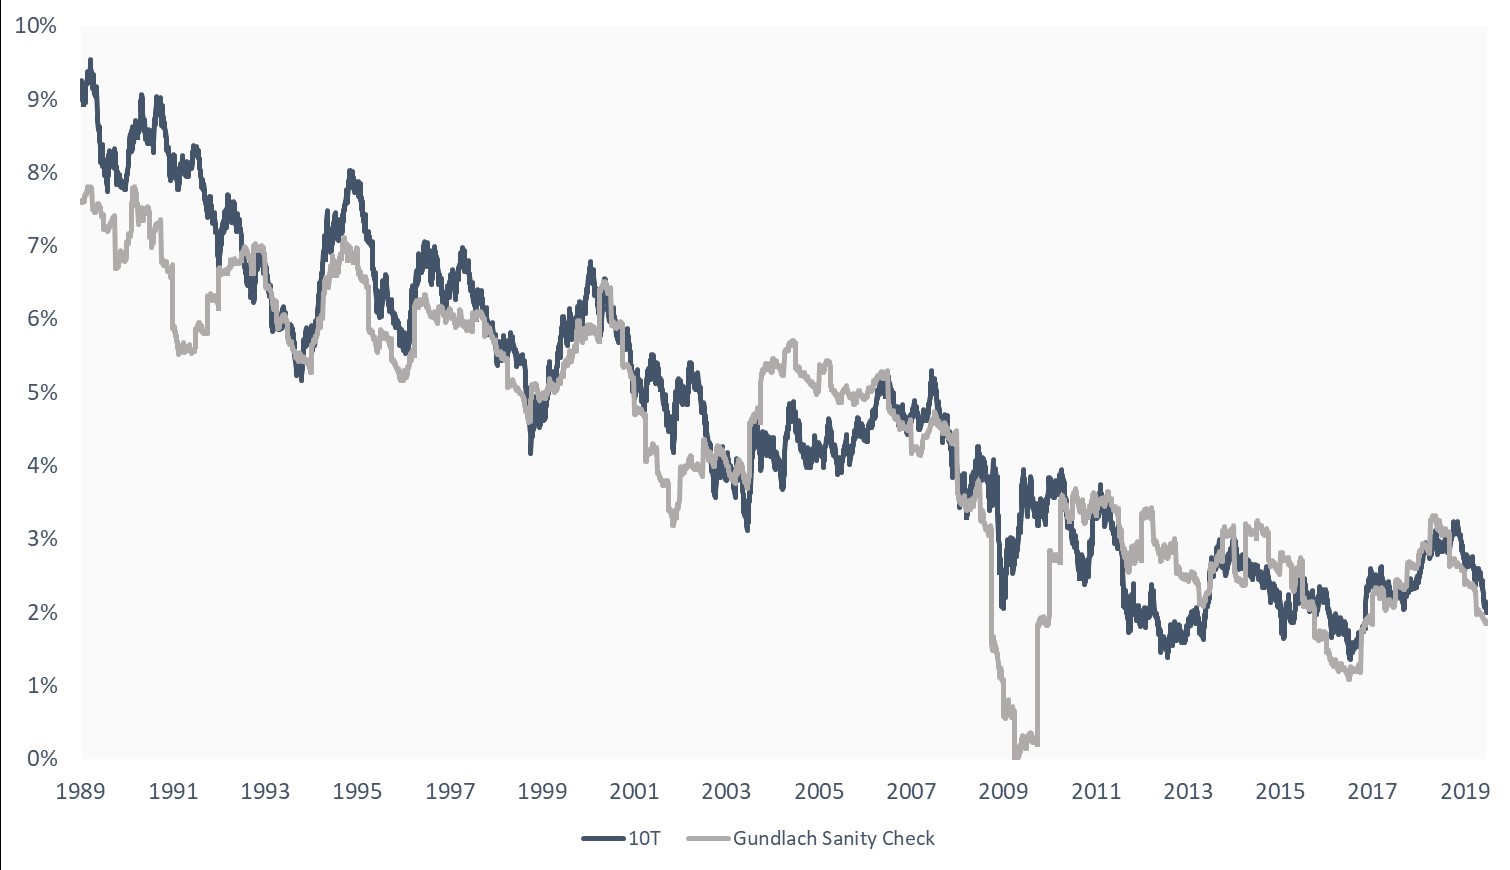
I’ve highlighted before Gundlach’s back of the envelope sanity check on the 10T. Given the dramatic movements over the last few weeks, I figured it was time to revisit and see if the drop is overdone.
(Nominal GDP + German Bund) / 2
(4.0% – 0.50%) / 2
= 1.75%
Pretty spot on. I guess that’s why he’s a billionaire and I’m not. Some examples of how the 10T could push to 2.25%?
- Bund rebounds to positive 0.50%
- Nominal GDP increases 1.0%
- Some combination thereof
How likely does any of that feel in the near term?
Here’s how his sanity check (grey line) tracks the actual 10 Year Treasury (blue line) since 1989.
Recession Watch
The St Louis FRED Smoothed Recession Index is a mouthful, but it’s actually a pretty useful tool. It predicts the odds of a recession within the next twelve months. Here’s the current reading, updated on August 1.
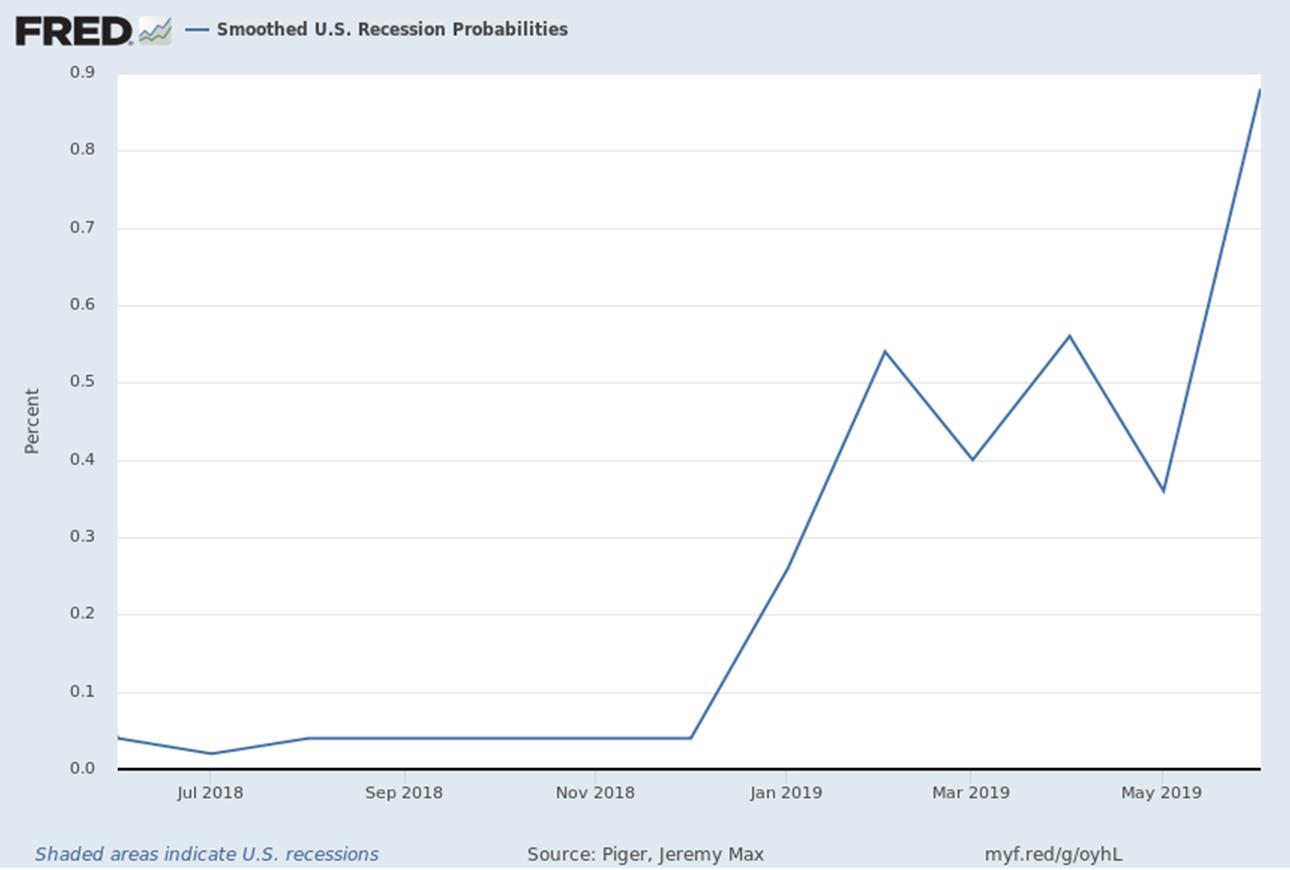
Scary, right? But it’s still less than 1%. It’s moving the wrong direction, but it’s not exactly sending up red flags, either.
Let’s zoom out and take a look at the same graph over 50 years. Like the Cowboys in January, the recent spike doesn’t even show up.
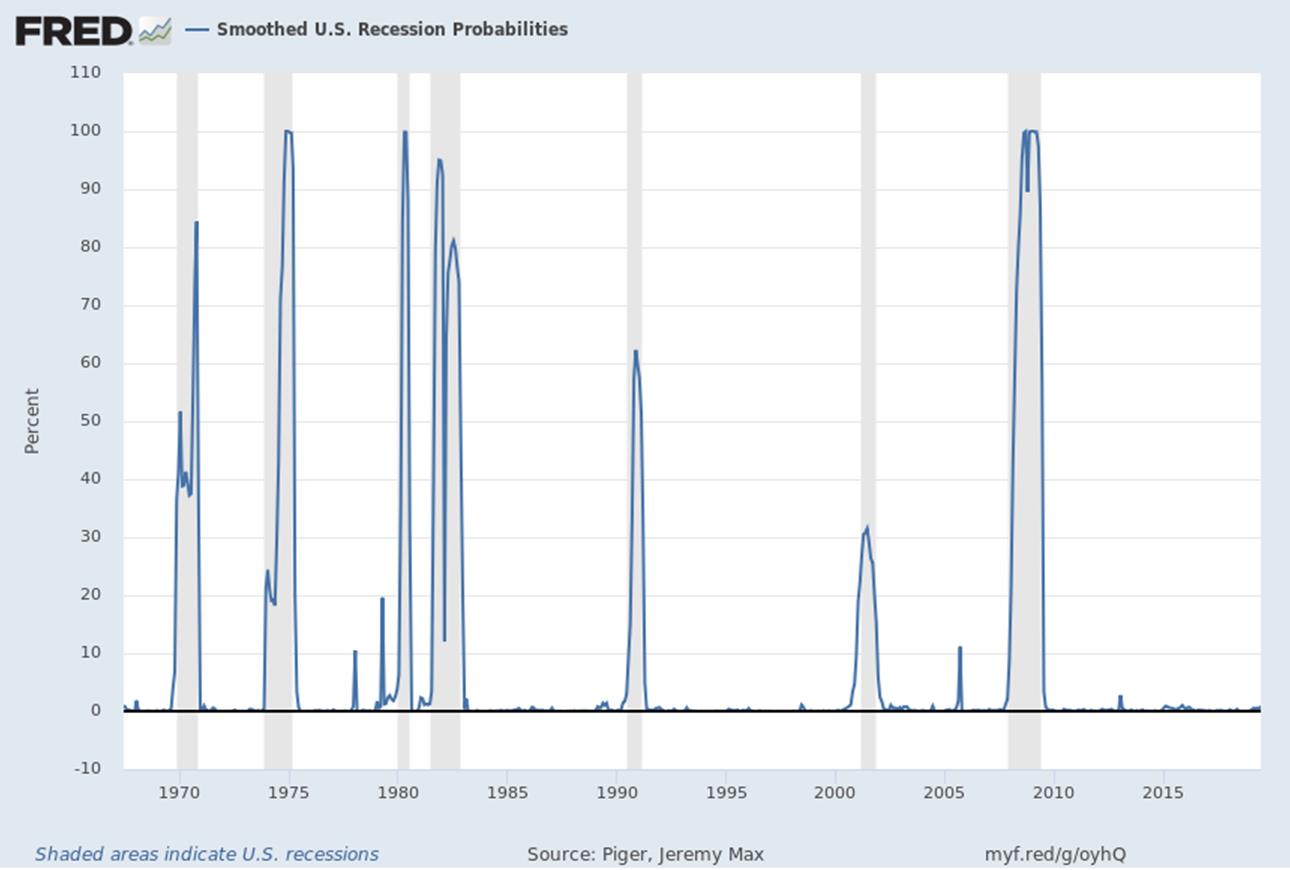
Key takeaways:
- This index does a terrible job of predicting recessions
- But it does a great job of confirming recessions
- And look how sharply it spikes – it provides almost no warning
Once this index exceeds 20%, we have a recession. At just under 1%, the data doesn’t suggest imminent danger. Unfortunately, it doesn’t bother giving us much lead time. It typically jumps dramatically in a short amount of time. It usually moves from 0% to 20% in less than six months.
Also, there’s a two-month lag. August’s update is really calculated from June’s data. That means we could already be 3%-4% and just not realize it yet. We’ll be keeping tabs on this to see if it climbs above 5%. Until then, not much to worry about.
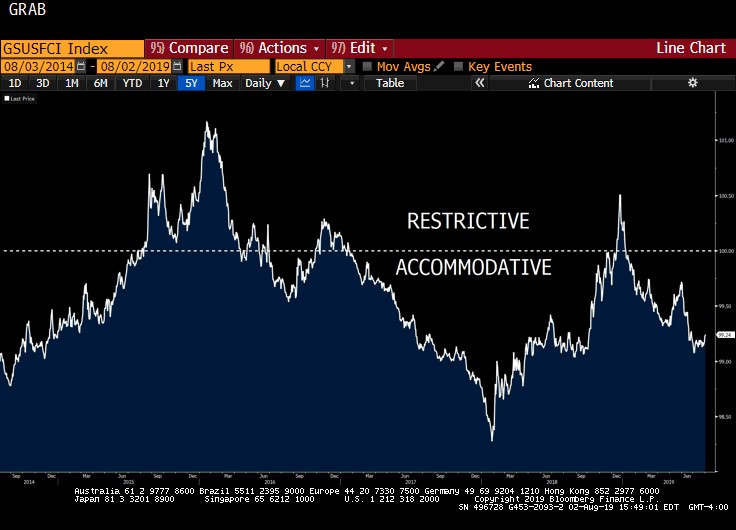
Now let’s check in with my favorite graph, Financial Conditions. Current conditions are still accommodative, and the Fed cut should help with that. This graph is also why Powell is hesitant to over-commit right now – conditions are already pretty accommodative.
Powell’s forward guidance will become a bigger driver of this going forward. If the market continues to express frustration with his views, conditions could tighten despite actual cuts.
The market will try to bully Powell into more aggressive forward guidance.
Bottom line – the economy is throwing up some warning signals, but nothing appears imminent.
Week Ahead
Quiet week on the data front, but plenty of residual rate movement likely following last week’s volatility.
Also, the Fed will likely march out several speakers to help massage the market’s interpretation of the rate cut.