

We have two dogs, Lady and Lucky. Lady is a tiny, yipping, Tasmanian devil that pees wherever she pleases and is the only dog I’ve ever seen to bark so much she actually loses her voice. Lucky is a chill golden retriever-ish mutt that reminds me of Wooderson from Dazed and Confused.
Since our family is determined to single handedly pay for Jeff Bezos’ trip to the moon, we get a lot of deliveries. When the doorbell rings, the little white dog loses her mind and is sprinting back and forth between the adjacent office and the front door. Clearly, an intruder is about to kick our door in and attack the family. “Someone pay attention!!!”
Lucky picks his head up and throws us an acknowledgement bark, but doesn’t actually get up. “Hey, someone’s at the door again…could be dangerous…probably not…maybe you should go check it out…but I’m not getting up.”
In what has to be one of the biggest reaches in newsletter history, I draw a comparison between our dogs and the yield curve response to rate hikes. Yeah. I guess this is the risk of writing in the middle of the night in a Tennessee hotel room at another sports tournament.
When the Fed rings the rate hiking doorbell, the front end of the curve loses its mind. Full blown panic, rates to the moon, cap prices through the roof, pandemonium. The long end of the curve lifts its head up like, “You don’t have to check it out, but it’d be a whole lot cooler if you did…”
This week we’ll discuss whether Lucky should be a little bit more alarmed when the doorbell rings. I will try to avoid overplaying the metaphor. Promise.
Last Week This Morning
- 10 Year Treasury peaked at 2.05% before falling to 1.93%
- German bund up to 0.20%
- Japan’s central bank is having to intervene aggressively to keep its 10 year yield pegged at 0%. It’s up to 0.23%, the highest level in six years.
- 2 Year Treasury all the way up to 1.46%
- LIBOR 0.16%
- SOFR at 0.05%
- Core PPI came in at 8.3% vs 7.9% forecast
- This was the primary culprit of the spike in yields early in the week
- US home sales up 6.7%
- Retail sales were very strong, 3.8% vs 1.0% forecasted
- FOMC minutes were slightly dovish relative to Powell’s QA that caused such a ruckus two weeks ago
- After Goldman and BofA revised forecasts to include 7 rate hikes, JPM came in over the top with a forecast of 9 straight hikes, which would put floating rates around 2.50% in just over a year.
Ukraine
There is some non-zero chance that Russia has invaded Ukraine by the time you’re reading this. February 20th (Sunday) has loomed large for two reasons
- Russia’s annual joint exercises with Belarus were set to conclude
- The Winter Olympics ended
Russia announced on Saturday that it would be, in a shocking coincidence, extending the exercises. “I mean, we’re already there so why not get a little bit more practice in?” I can hear Putin saying.
The impact on markets is TBD when there are so many other things going on domestically. Ukraine is the 8th most populous country in Europe (2nd largest in land size), so it’s not nothing. Furthermore, the resulting sanctions will serve as a drag on the global economy, most acutely in Europe.
While we may experience a typical flight to safety move that pushes yields down, I have a tough time imagining that driving rates more than rate hikes and balance sheet reduction over the course of 2022. This is particularly true when Biden has taken the risk of US troops off the table.
Treasury Volatility
The three most volatile periods of time for US Treasurys in the last twenty years is the financial crisis, the Taper Tantrum, and the 2016 election.
You can add “now” to that list.
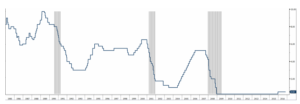
Interestingly enough, however, that really only applies to the front end of the curve. Here’s a super complex way of comparing volatility in the front end of the curve vs the long end of the curve. The gap between the two was only higher at the height of the financial crisis.
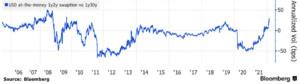
Front end volatility is obviously directly linked to the sudden change of heart by the Fed. Cap prices have tripled in the past month, actually exceeding the volatility we saw in 2016 after Trump was elected.
But what’s up with the T10? Sure, it climbed to 2.0%, but relatively speaking that’s nothing. Acknowledgement bark.
Bloomberg’s rates team puts the T10 at 1.98% at year end and just 2.23% at the end of 2023. What a snoozefest.
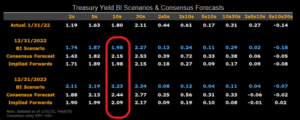
Despite having just been burned on the front end of the curve, markets are shockingly complacent on the long end. When people ask me where I think the T10 is headed, I largely agree with Bloomberg…but I also think something like 3.0% can’t be ruled out anymore. Maybe the door actually is about to be kicked in?
Markets are Still Sanguine on Inflation
Market pricing in CPI of 3% over the next year, about 2.75% the year after, and continuing to fall thereafter.
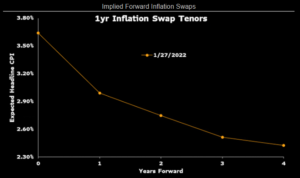
In fact, forward-looking inflation expectations are actually at their lowest point in a year.
Source: Bloomberg Finance, LP
Although I happen to agree with the market on inflation, there’s a risk the market is repeating the same mistake of complacency that just hammered it on the front end of the curve.
The Fed Usually Hikes Us Into a Recession
The Fed has an amazing track record of hiking us into a recession. Here’s Fed Funds with grey recession bars to really drive the point home.
The one time when the Fed avoided a recession was the mid-1990’s when it quickly cut a couple of times and then held steady for several years…before hiking us into a recession.
The market is fast forwarding to the part where we realize it’s just the Amazon driver again. The Fed will over-hike, will end up cutting rates, and let’s just skip the chaos the little white dog creates in between.
Treasury Market Depth/Liquidity is Down
Liquidity in the Treasury market is down based just on the fact that the Fed will be reducing the balance sheet. The Fed indicated reduction would begin “soon after” rate hikes, which implies a May-ish start.
I suspect they will start slow, reducing the balance sheet by about $30b per month. This will climb to about $90B per month before leveling off. At this point, the reductions will hold steady at $90B per month and will be set on autopilot until markets seize up and the economy topples over the Fed deems it appropriate.
This sort of reduction is unprecedented, and we really don’t know how markets will behave. But it’s clear that it’s already having an impact on liquidity.
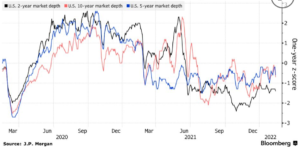
Lack of liquidity translates into big rate swings. While the clear risk is that this means rates move higher, lack of liquidity could also translate into a sharp move lower. Illiquidity implies volatility, not direction.
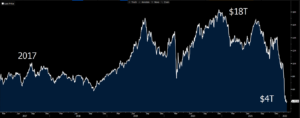
Global Negative Yielding Debt Has Plunged
One of the primary constraints to higher yields has been the lack of alternatives. How many times have we said, “When the alternative is -0.50%, a 1.50% 10 Year Treasury looks great”? As the global economy emerges from the covid recession, the amount of negative yielding debt has fallen off a cliff.
Source: Bloomberg Finance, LP
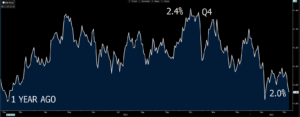
In fact, the spread between the T10 and German bund is at eerily similar levels to the spread at the start of the last tightening cycle. During the two years of rate hikes, the spread widened to 2.80%.
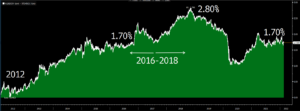
Source: Bloomberg Finance, LP
Keep an eye on the spread between the two safe haven assets. At a minimum, a rising German bund gives the T10 rope to move higher.
Week Ahead
Aside from Ukraine, the big news this week will be Core PCE, the Fed’s preferred measure of inflation.