LIBOR Replacement – SOFR Publishes Tuesday
Karma is a Grayson Allen buzzer beater touching every part of the rim but failing to drop. I am going to petition the NCAA for another year of eligibility because if he continues to regress at this rate, I’ll be able to take him one on one next year.
Last Week This Morning
- 10 year Treasury down to 2.74%
- German bund down another 0.03% to 0.49%
- 2 year Treasury dropped 0.03% to 2.26%
- Yield curve flattened to its lowest level since September 2007
- LIBOR hit 1.89%
- LIBOR has climbed 37 consecutive days, the longest such streak since 2005
- This is more than just Fed tightening and the LIBOR-OIS spread widening is an important contributing factor
- Core PCE came in as forecasted at 1.6% y/y
- Univ of Mich Consumer Confidence Index hit 14 year high
- All gains were within households in the bottom third income bracket
- Highest income bracket actually experienced a 5.6% decline in confidence
- Chicago PMI missed for the third consecutive month
LIBOR Replacement – SOFR
On Tuesday at 8am, the NY Fed will begin publishing the hopeful replacement for LIBOR – the Secured Overnight Financing Rate, aka SOFR.
While LIBOR asks participating banks to submit their cost of funds for an unsecured loan from another bank, SOFR is a rate between banks for an overnight loan backed by Treasurys (more like a risk-free index).
The intent is to shift to a market-driven rate and away from the survey-based LIBOR report. Last week we addressed the recent widening of the LIBOR-OIS spread, which is a good example of why the regulators want to make this transition.
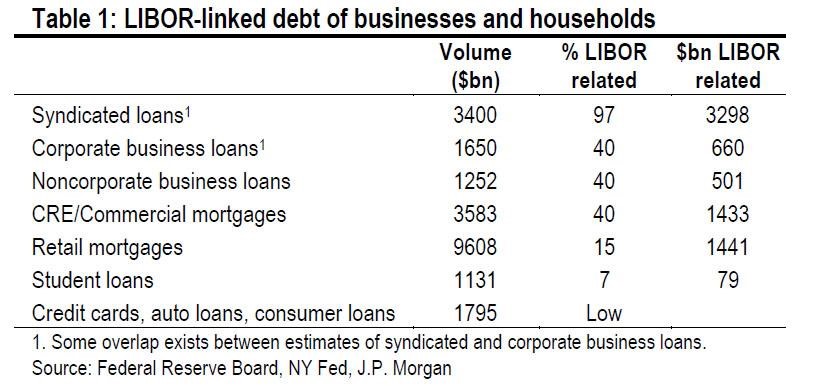
JPM published this graph illustrating the total LIBOR borrowings of non-financial institutions and highlighted that the recent LIBOR-OIS spread widening of 35bps has cost the business sector about $21B of interest and the household sector about $5B of interest. While those don’t seem like the type of numbers to break the system, it is a real cost that has to come from somewhere.
The CME is set to launch its SOFR futures on May 7th, which will be critical to the long-term success of SOFR. LIBOR has become the go-to index in part because of the derivatives market. Without trust in the SOFR forward curve, hedges like swaps and caps will fail to catch on and make universal adoption more challenging.
Interest Rate Trap
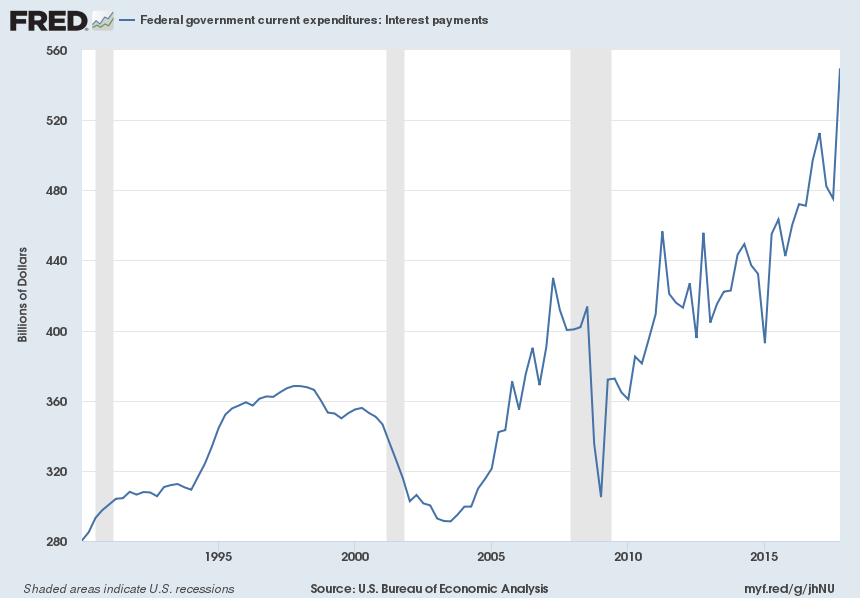
Rising interest rates mean it becomes more expensive for the federal government to finance its debt. In order to pay for this higher interest expense, the government issues more bonds. This increases its interest expense, which in turn drives the need for further issuance, and so on and so on. Here’s a graph illustrating the interest payments made by the US government since 1990.
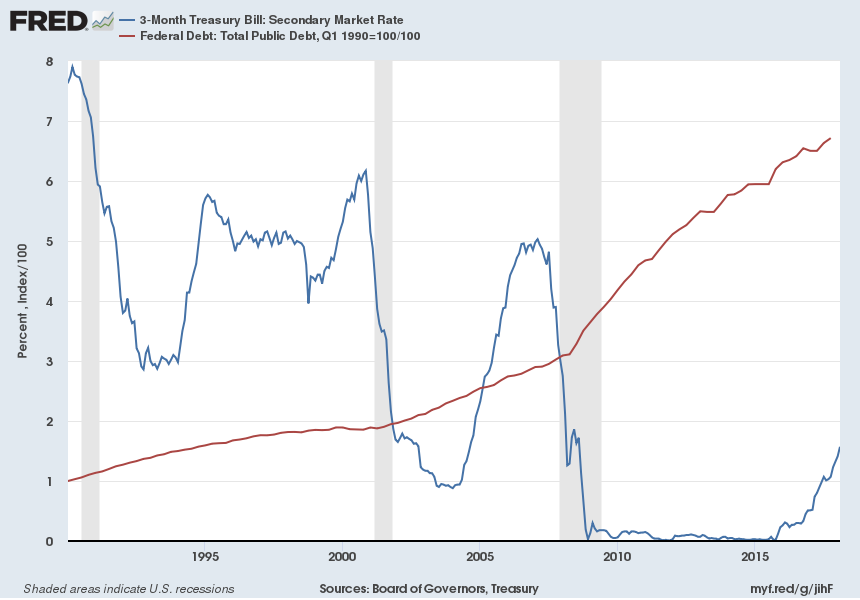
Here’s a similar graph with total federal debt (red line) coupled with the 3 month T-bill (blue line). The government’s massive issuance benefited from 0% interest rates, but once the tightening cycle began in earnest, the impact to interest expense in the graph above was amplified by the massive debt balance.
With interest rates rising and bond issuance surging, the recent tax cuts and Fed’s balance sheet normalization process only compound the effect. This supply gap could contribute a net $800B of issuance this year, which should apply further technical upward pressure on yields.
If you’ve been reading this newsletter for a while, you know we are believers in a prolonged low interest rate environment; however, we could experience unprecedented technical factors on rates that could drive the 10 year Treasury higher over the remainder of the year.
But…
That doesn’t mean the 10 Year Treasury is headed to 4.0%. The Fed has a remarkably consistent track record of hiking us into a recession. And at some point the folks over in Treasury probably make a call to the Fed, “soooooo, any chance you guys can stop hiking so we can afford to make our interest payments?”
And while we believe the theme of global removal of accommodation will continue with the ECB tapering in Q4, last week Goldman Sachs released a report indicating the ECB’s purchases actually doubled from the week prior. It seems Draghi is intent on avoiding any sort of market shock and that is a contributing factor to the German bund dropping back below 0.50%. How high can the 10T move if the bund is stuck at half a point?
This Week
Headline data this week will be Friday’s job report. Consensus forecast is a gain of 195k jobs (remember last month was incredibly strong at 287k) with an unemployment rate of 4.0%.
It will be interesting to see the market response if the UR breaches that psychological level and prints a number with a 3-handle.
Just as importantly, markets will be examining the average hourly earnings from that report for any signs of inflation.


