

Last Week This Morning
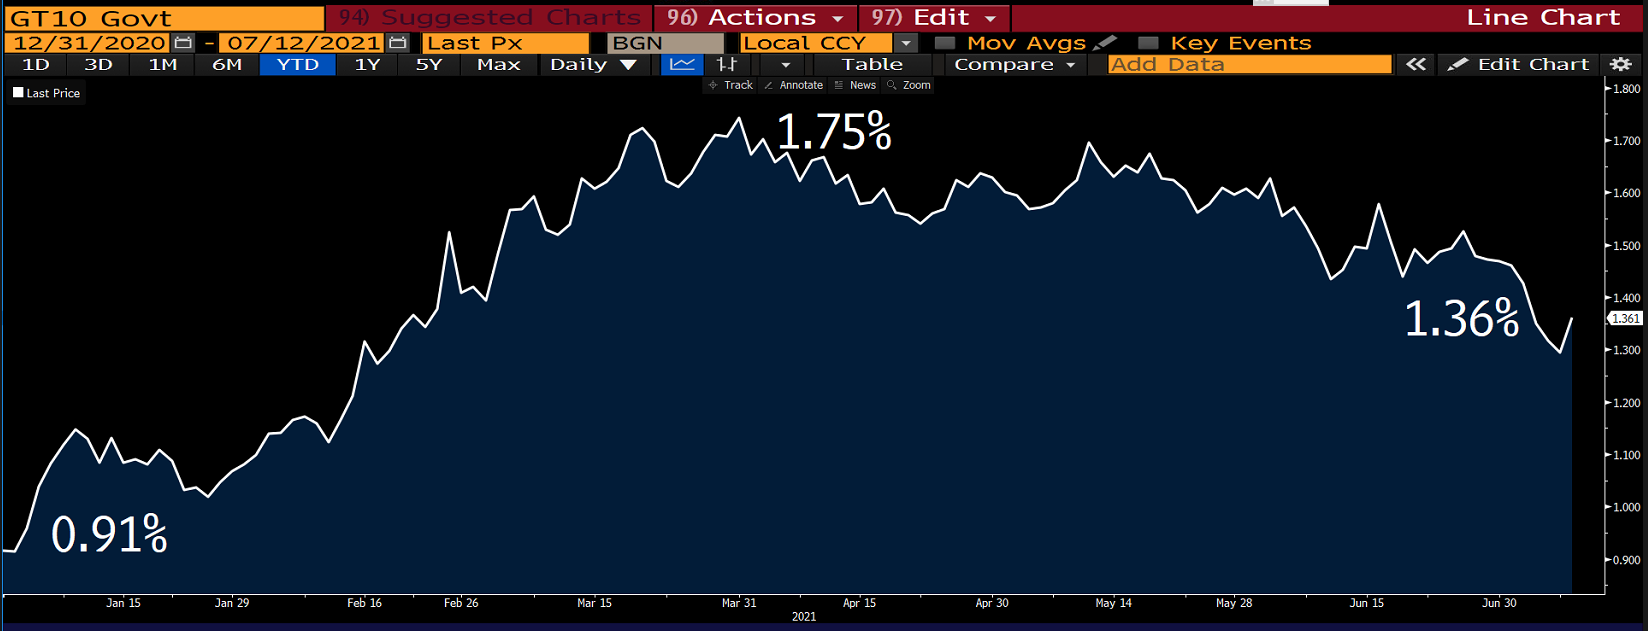
- 10 Year Treasury plunged to 1.25% briefly before rebounding to 1.36%
- Yield curve is flattest it has been since February
- German bund down 6bps to -0.29%
- 2 Year Treasury down 2bps to 0.21%
- LIBOR at 0.10%
- SOFR at 0.05%
- The Fed hinted at beginning to taper slightly sooner than expected, so Q4 this year is officially on the table
FOMC Minutes
The first hint of tapering hit the headlines, “Various participants mentioned that they expected the conditions for beginning to reduce the pace of asset purchases to be met somewhat earlier than they had anticipated at previous meetings.”
Tapering is generally thought to have the following impacts:
- The biggest buyer is slowing its pace of purchases, which should have some sort of impact on price (price goes down, rates go up)
- Turning off the printing presses may cool inflationary pressures
- Removal of accommodation could upset the recovery
- The Fed won’t begin hiking until after it is completely done tapering
The tapering will gradually slow the pace of purchases from $120B/mo to zero. This will probably happen over the course of a year, likely most or all of 2022.
But it’s not like demand dries up entirely. When the 10T broke through 1.00% in January, foreign buying of Treasurys spiked.
Check out this graph of foreign holdings of US debt. It has continued to climb as negative yielding debt around most of the world makes our yields attractive (yes, there’s a whole different discussion about Japan and China owning such an enormous amount of US debt). 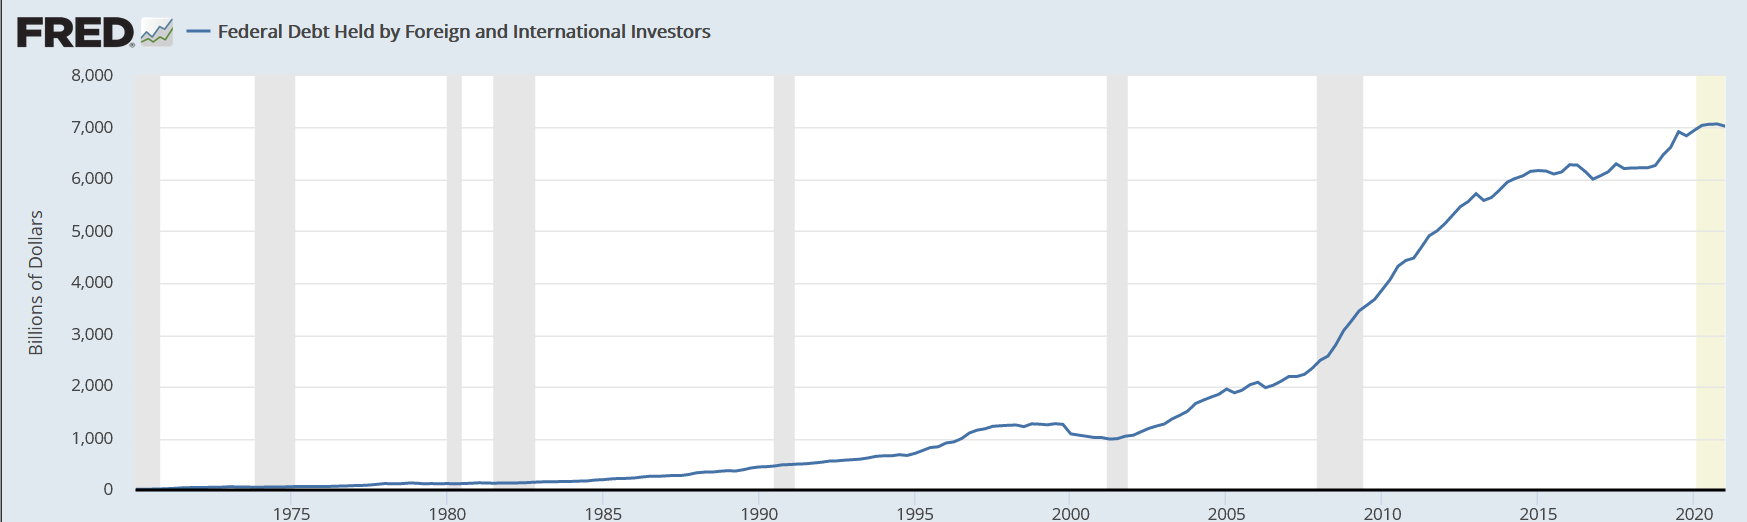
If tapering puts upward pressure on yields, foreign buying will step up again and keep a lid on the rate movement. The Fed is a buyer at any price, and that makes it unique, but the drop off to the next buyer isn’t that big.
The May 2013 Taper Tantrum was such a shockingly painful event that everyone is laser focused on tapering, but I think it will be largely a non-event this time around. Everyone knows it’s coming.
And since the Fed won’t hike until tapering is completely done, taper-obsession is mostly about targeting the window for when hikes might begin. If the Fed begins tapering in Q4, it would conclude by year end 2022. That, in turn, means the Fed could begin hiking at the start of 2023. I don’t think that’s what will happen, but the market will have to price in at least some small probability of that occurring.
Mo’ Money, Mo’ Inflation
About a dozen times a week, we get asked some variation of the following question, “How can we not have inflation with all the Fed accommodation and stimulus spending?” Mo’ money, mo’ inflation. Exhibit A from this camp is this graph – money supply. It has to cause inflation, right?
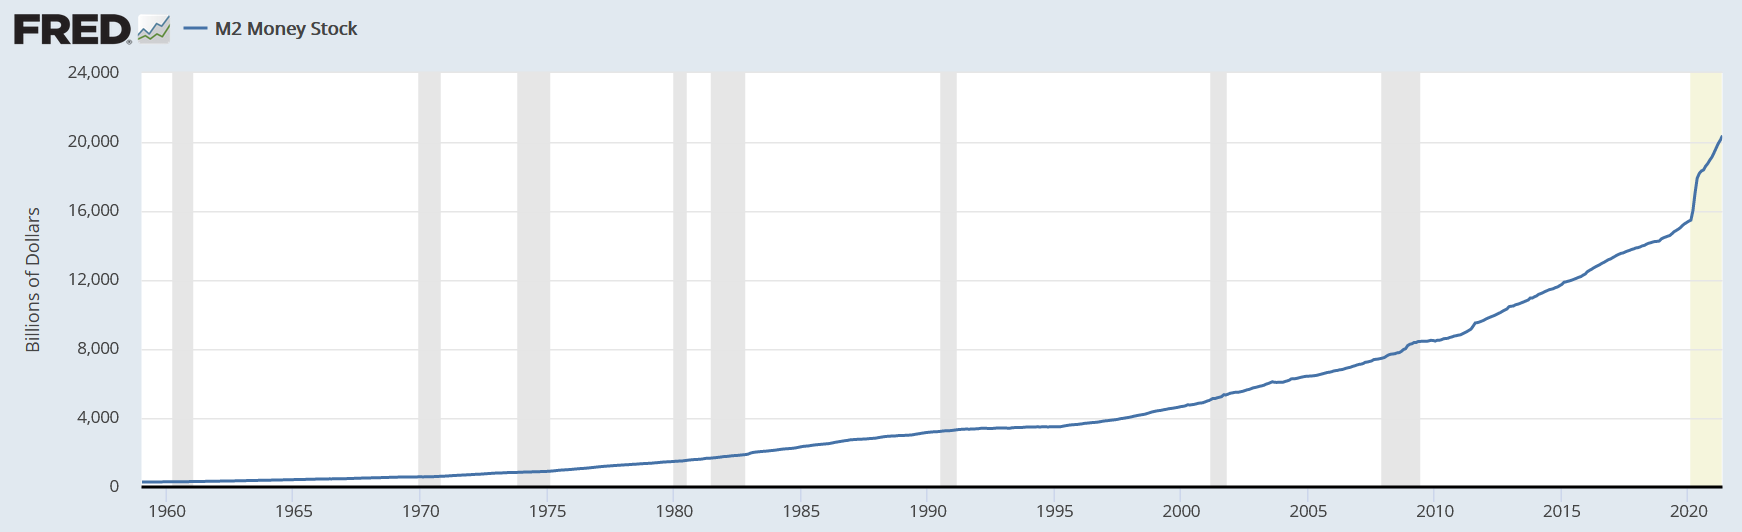
No.
It doesn’t matter how much money is printed if it doesn’t exchange hands. Period. This graph is the velocity of money supply. It answers the question – how often does money change hands? As you can see, it isn’t.
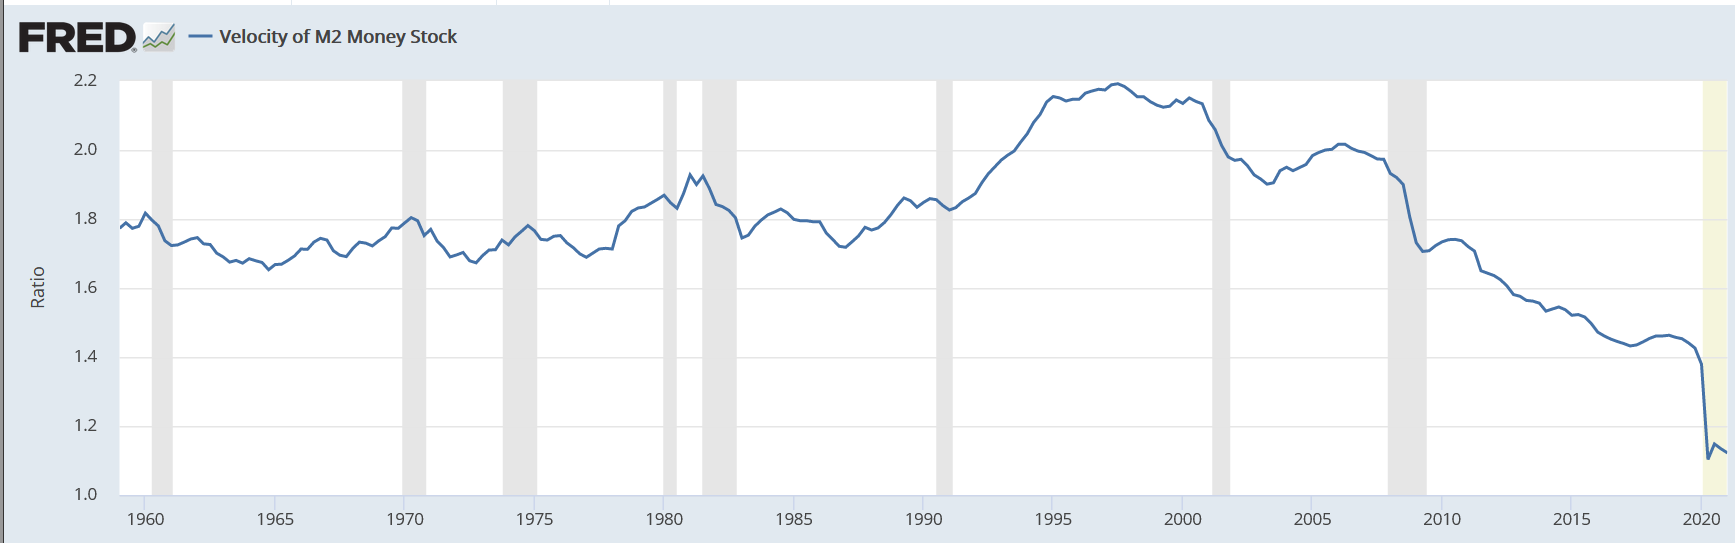
Not only is money not exchanging hands, it’s the slowest velocity ever. By a wide margin.
Yes, the amount of money out there is staggering. And if it started circulating at a pace like we saw in the 1990s, we would have inflation. But right now it’s just sitting on balance sheets.
To convince me we will experience inflation, you must first convince me money will actually circulate.
10 Year Treasury
While stocks have been on a one-way trajectory this year, the 10T has experienced quite a wild ride.
As we discussed recently, the violent swings lower have largely been driven by short covering. JPM’s survey of clients revealed a pretty large net short position.
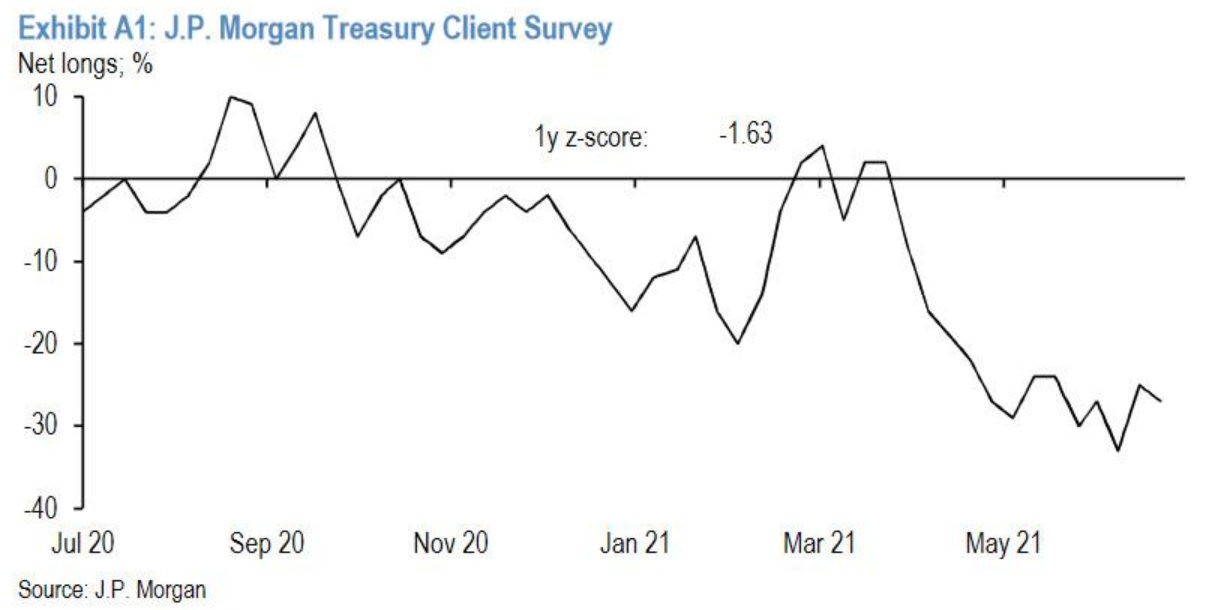
When the collective pain to bear that carry trade becomes too much, the squeeze pushes yields lower even when underlying fundamentals haven’t really changed.
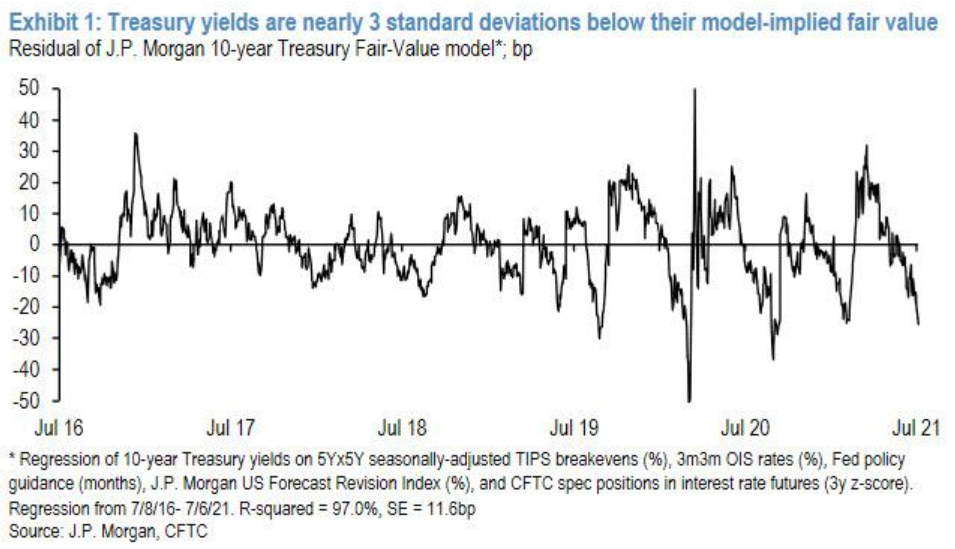
Here’s the thing – if 2.00% is too high, 1.00% is probably too low. Just because things won’t prove to go perfectly doesn’t mean they aren’t going pretty well. The same JPM report suggests the 10T yield is 3 standard deviations too low right now.
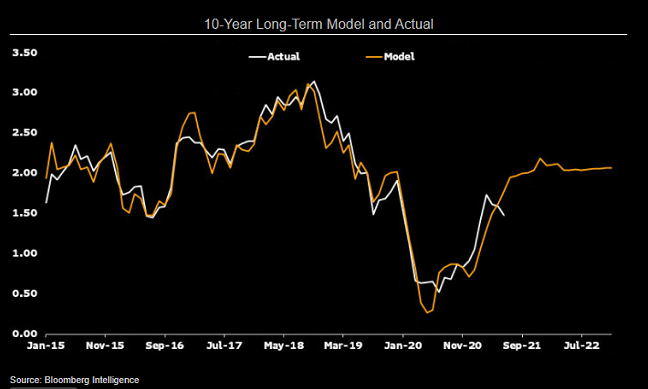
JPM isn’t alone. The Bloomberg Intelligence model suggests the 10T should be closer to 1.77%.
It’s not a coincidence the 10T tested 1.27% before rebounding. If we break through 1.27%, the next stop is 1.00%. I don’t think that’s the base case, but it can’t be ruled out. This week’s inflation data is exactly the type of catalyst for that type of movement.
More likely, I think the 10T moves back to 1.50% as the short squeeze dissipates and traders have pressed the reset button.
Week Ahead
Huge week ahead for inflation reports. We’ll also get some retail sales and manufacturing data, but all eyes will be on the inflation data.