

After one of the most volatile weeks ever, this will be longer than usual. I tried to use lots of pictures to soften the intellectual lift – they certainly made writing it easier!
Last Week This Morning
- 10 Year Treasury plunged again and closed out at 1.55%
- 30 Year Treasury breached 2.00% for the first time ever, getting as low as 1.915% before rebounding and closing the week at 2.035%
- German bund reached an all-time low of -0.73% before closing at -0.69%
- Japan 10yr down slightly to -0.24%
- 2 Year Treasury fell significantly and closed at 1.47%
- LIBOR at 2.17% and SOFR at 2.18%
- Something about the 2s/10s curve inverting?
- The US now comprises 94% of positive-yielding investment grade debt
- The average non-US investment grade debt yield is just 2bps (yes, 0.02%)
- Argentina President Macri suffered a shocking primary loss to socialist-ish running mates Fernandez/Kirchner. Macri had gained the confidence of investors for austerity measures and negotiations with the IMF and markets fear that progress could be undone and there could be defaults on the horizon.
- Although this was a primary only and the general election held in October, the beating was so bad that some in Tuscaloosa were overheard saying, “Macri got Clemson’d”
- Kirchner is the former Argentina President with 11 corruption indictments under her belt. Although she’s technically the VP candidate, she announced her campaign in May and then backfilled the President spot. Argentinian votes are choosing a corrupt socialist government over capitalism and all its pesky consequences for bad choices
- The peso is down 37% ytd
- Japan surpassed China as the largest non-Fed holder of US Treasurys
- Germany’s economy contracted in Q2, with GDP coming in at -0.1%
- ECB officials are signaling significant accommodative measures at the September meeting, saying the ECB “will announce a package of stimulus measures at its next policy meeting in September that should overshoot investors’ expectations.”
- Hong Kong protests contributed to a $2.4B stimulus package over fears the ripple effects will tip its economy into a recession. Firms like Disney and HSBC are already reporting financial impacts from the protests.
- According to the Spectator, Fed President Powell has banned any public appearances by any Fed Board member, noting that “appearances at conferences have been canceled, all scheduled interviews have been abandoned and any comments on or off the record are outlawed.”
- University of Michigan Consumer Sentiment missed forecasts significantly as consumers respond to tariffs and rate cuts
- US manufacturing data showed contraction last month
- Other than that, how was the play Mrs. Lincoln?
Inversion
The yield curve inverted for the first time since May 2007. Over the last 50 years, every inversion has preceded a recession. I’m not falling for the whole narrative around how it was temporary and corrected immediately. As our inversion study concluded, during periods of inversion the curve is generally positive two days for every one day it is negative.
And…that window typically lasts almost two years. We will likely be talking about inversion for the foreseeable future. Thursday was just the beginning.
And..don’t forget the 3m Tbill vs 10T has been and continues to be inverted. Thursday just happened to be the first time the more traditional measure using 2s/10s inverted.
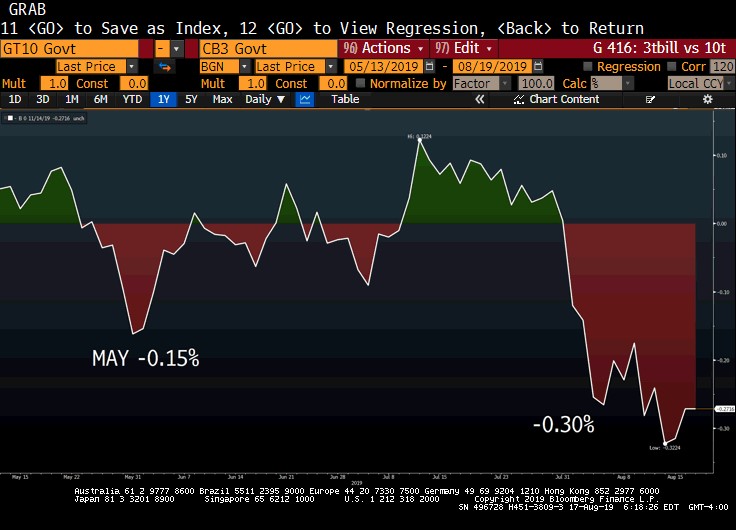
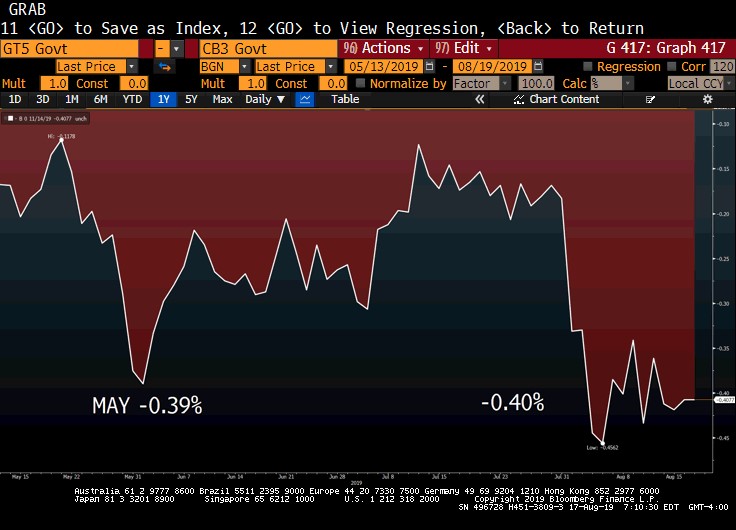
Some prognosticators prefer 5 year rates vs 3 month rates as the better measure. Let’s take a look.
Whoops.
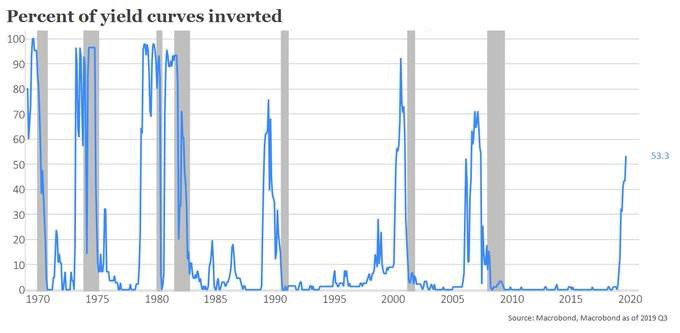
Macrobond put together this cool analysis that examines global yield curves to determine what percentage are inverted. More than half the globe is dealing with inverted yield curves right now.
Recession
On average, the US experiences a recession about 15 months after an inversion (Nov 2020) and it almost always takes at least a year before the onset of the recession. Democrats rejoice, Republicans facepalm.
Stocks typically experience a last gasp rally, peaking 2-3 months after the inversion before waiving the white flag. Here’s a really detailed graphic we put together to summarize the typical timeline.
3 months 12-15 months
Inversion —————-> Stocks peak —————-> Recession
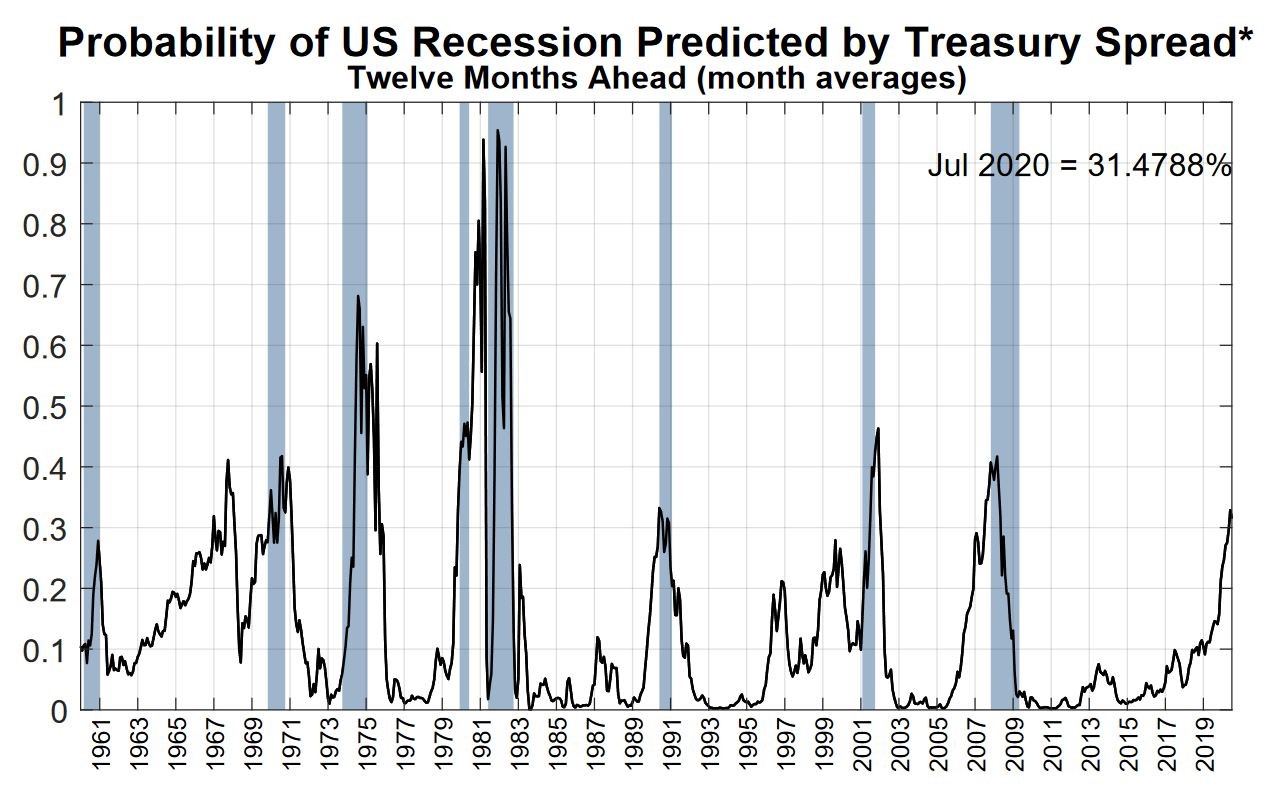
We’ve highlighted before the Smoothed Recession Probability the St Louis Fed puts together, but the NY Fed has its own measure. It is entirely driven by market indices, so it is elevated relative to other measures of recession probability since so much stock is put into inversions.
The NY Fed Index puts the odds of a recession within the next year at 31.5%.
Perhaps more importantly, the line of demarcation appears to be 30%. With only one exception (1967), when the odds exceed 30% we ultimately have a recession.
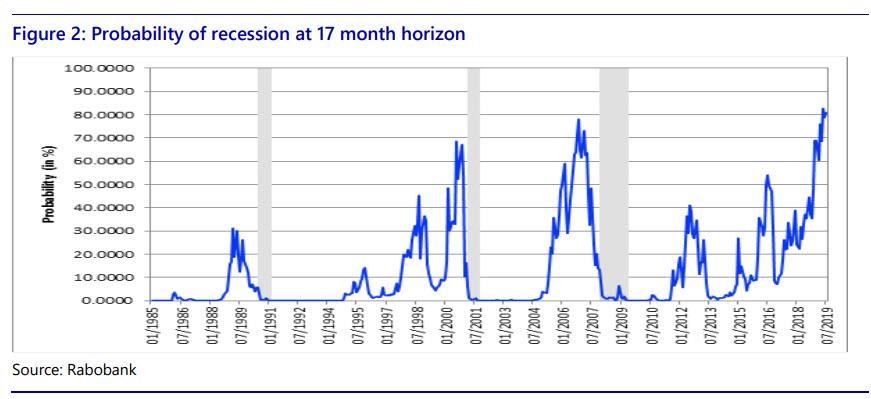
And from the department of “Piling On”, Rabobank’s Recession Probability Index is at an all-time high. Rabo’s index puts the odds of a recession within the next 17 months at more than 80%.
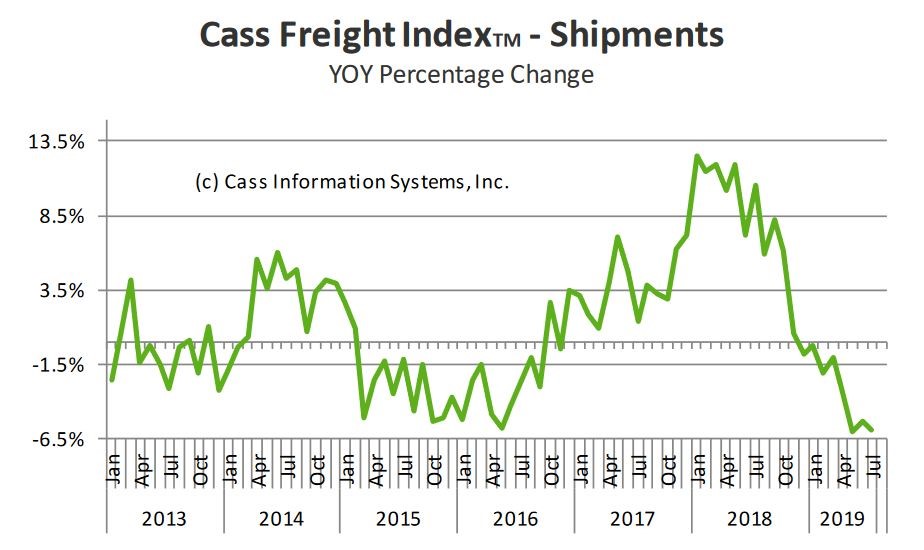
Cass Information Systems processes more than $28B in freight payments annually. The Cass Freight Index historically has done a good job of predicting recessions because those payments lead the slowdown. They suggest GDP could turn negative as early as this quarter. Here’s a link to the full publication, but I will highlight a few key takeaways. Cass Freight Index
Freight volume has declined for eight straight months.
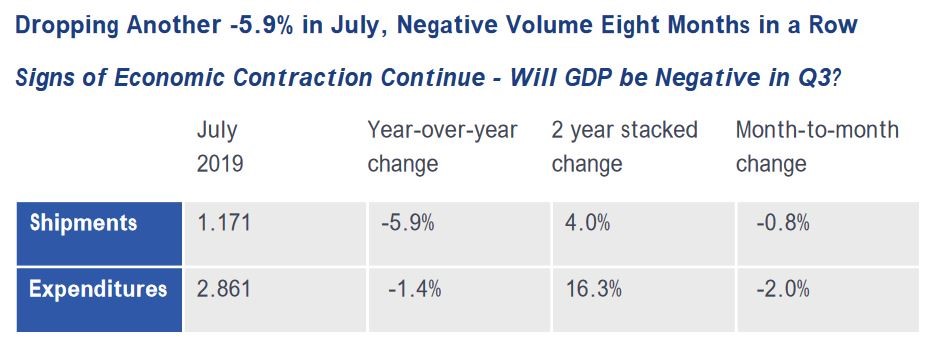
Cass predicts that Q3 GDP will be negative or nearly negative, and that if shipping trends continue GDP will be negative by year end.
There have been false positives before, so this index is not batting 1.000. But its good enough that we should be paying attention. They also addressed two issues on this year’s relatively strong GDP readings.
Q1 GDP of 3.1% – inventory build-up, escalated exports, and declining exports, effectively the result of front running the trade war, artificially increased GDP by 1.3%. Adjusting for those, and true GDP was 1.8%.
Q2 GDP of 2.1% – government expenditures accounted for 0.85% of GDP, the largest contribution since early 2009. Adjusting for that amount, true GDP was more like 1.3%.
Are We (Read: Am I) Overreacting to the Threat of a Recession?
A few weeks ago, I wrote about biases. On the topic of economic downturns, I likely experience Saliency Bias. Because the 2008 crisis was so impactful to me, I give it outsized weight. The next downturn doesn’t have to be like the last one. Maybe it’s just a cooling off, not a full-blown crisis, and I can’t spend the next 12-18 months basing decisions out of fear.
The commonly accepted definition of a recession usually cites two consecutive quarters of falling GDP; however, the people in charge of officially tracking recessions don’t actually ascribe to that definition. In fact, the National Bureau of Economic Research (NBER) actually points this out on their website since it is so commonly misquoted. In other words, a recession is actually far more subjective than we usually believe it to be.
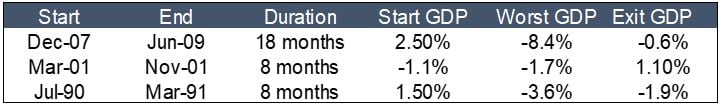
Let’s look at how the economy fared over the last three recessions. Hint: 2008 was far worse than the others.
GDP
Sure, the economy contracted, but aside from 2008 the slowdown wasn’t catastrophic.
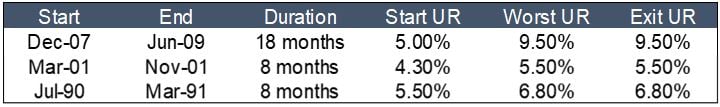
Unemployment Rate
In 1991 and 2001, the unemployment rate only increased 1.25% on average. A similar movement now would translate into just 4.95% unemployment rate. Also, the UR tends to peak at the end of the recession.
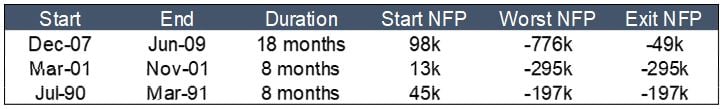
Monthly jobs gained/lost (3-month average)
Job gains tend to bounce along zero before turning sharply negative.
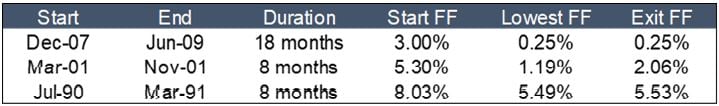
Fed Funds
No surprise, Fed Funds moves down ahead of the recession and keeps moving lower.
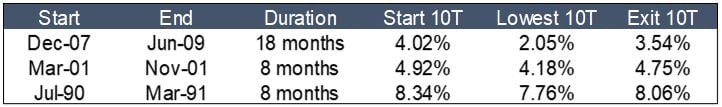
10 Year Treasury
The 10 Year Treasury experiences less volatility than the others during recessions. This is because the market is already pricing in the downturn by the time we are actually in the recession.
Takeaways
The only people with memories of a recession other than the 2008 financial crisis are those that have been in the workforce for over 20 years. We (I) might be overly concerned about a recession.
Fed Funds will likely move lower, while the 10 Year Treasury will move ahead of the recession and then remain range-bound.
I am more worried about the effects a recession has on lending appetite than massive tenant defaults, interest rates, etc.
Rates Are Going to 0% Again
There is a very real chance the Fed will cut rates to 0% over the next 18 months.
On June 17th, our newsletter was entitled, “Even With 3 Rate Cuts Priced In, the Market is Probably Too Optimistic.”
Here’s the graph we used to defend our position. The solid blue line is actual LIBOR, the grey lines are the forward curve at various times during the easing cycle. Notice how the market consistently overestimates the path of LIBOR during a rate cut cycle.
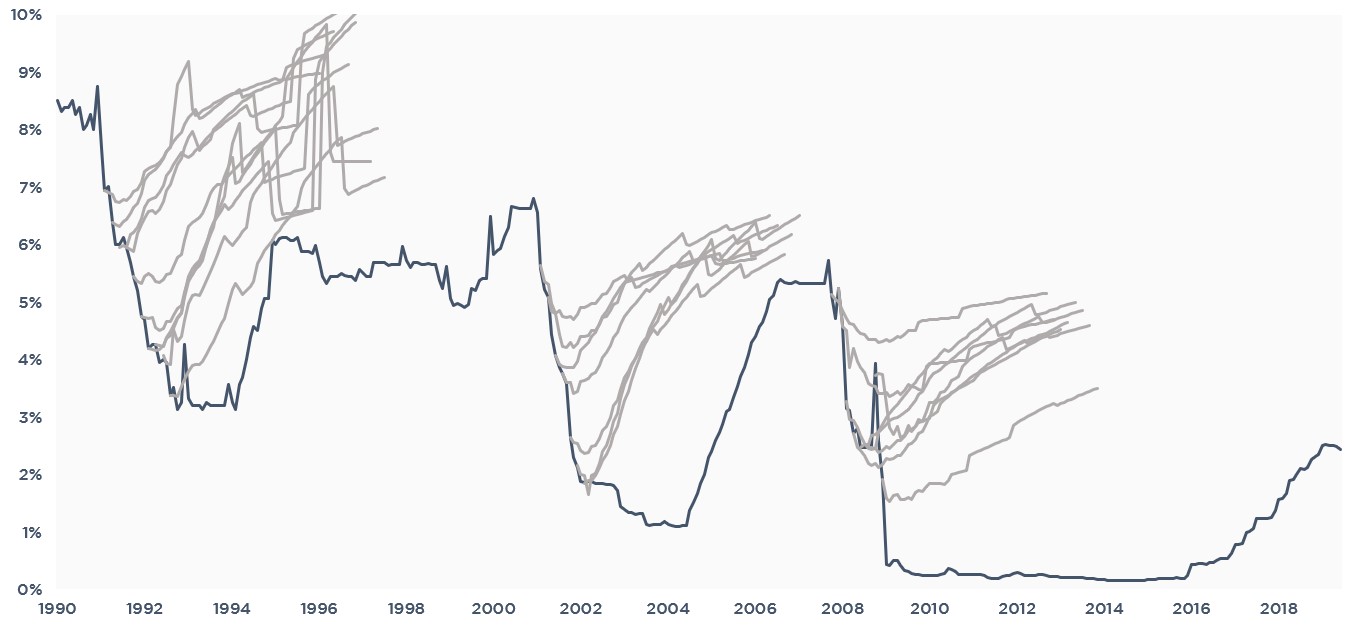
The market now has a total of 6 rate cuts priced in, with Fed Funds reaching 1.00% in two years.
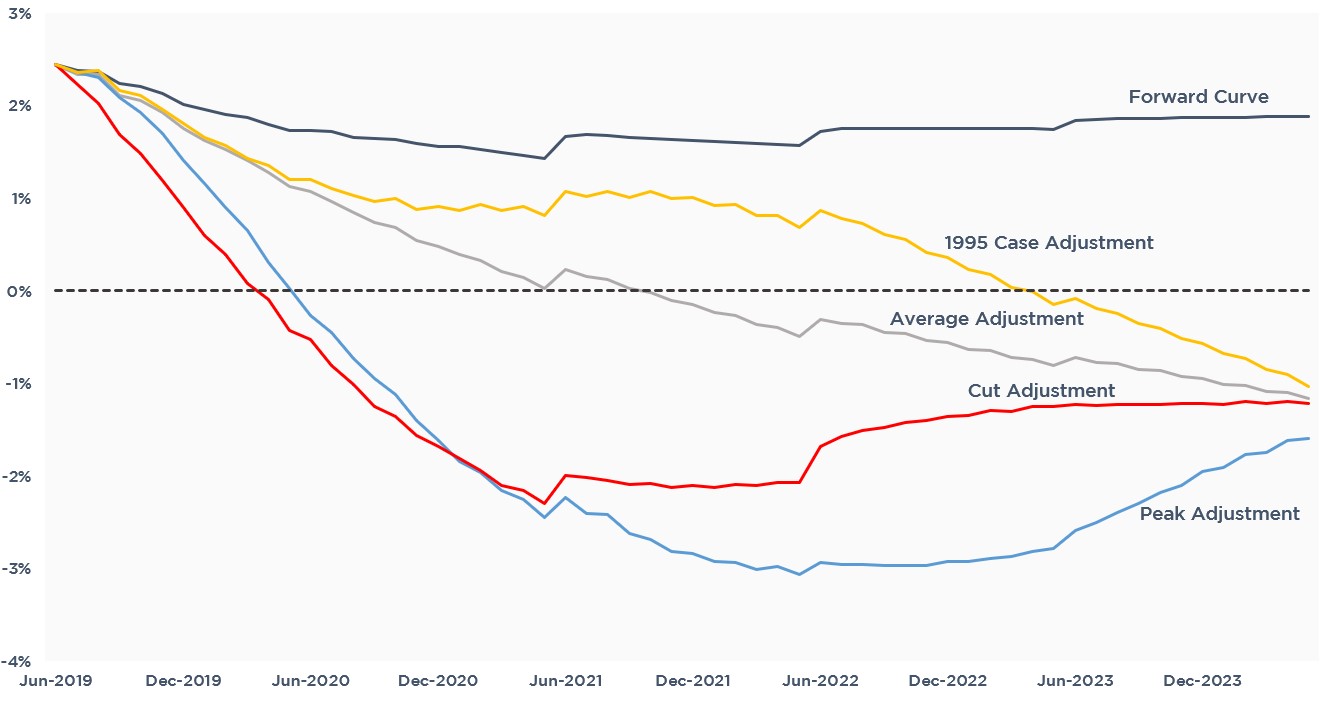
We then took the previous easing cycles rate movements and applied them to the current forward curve to examine what we might expect going forward.
Notice how in every scenario we ultimately test the zero lower bound again.
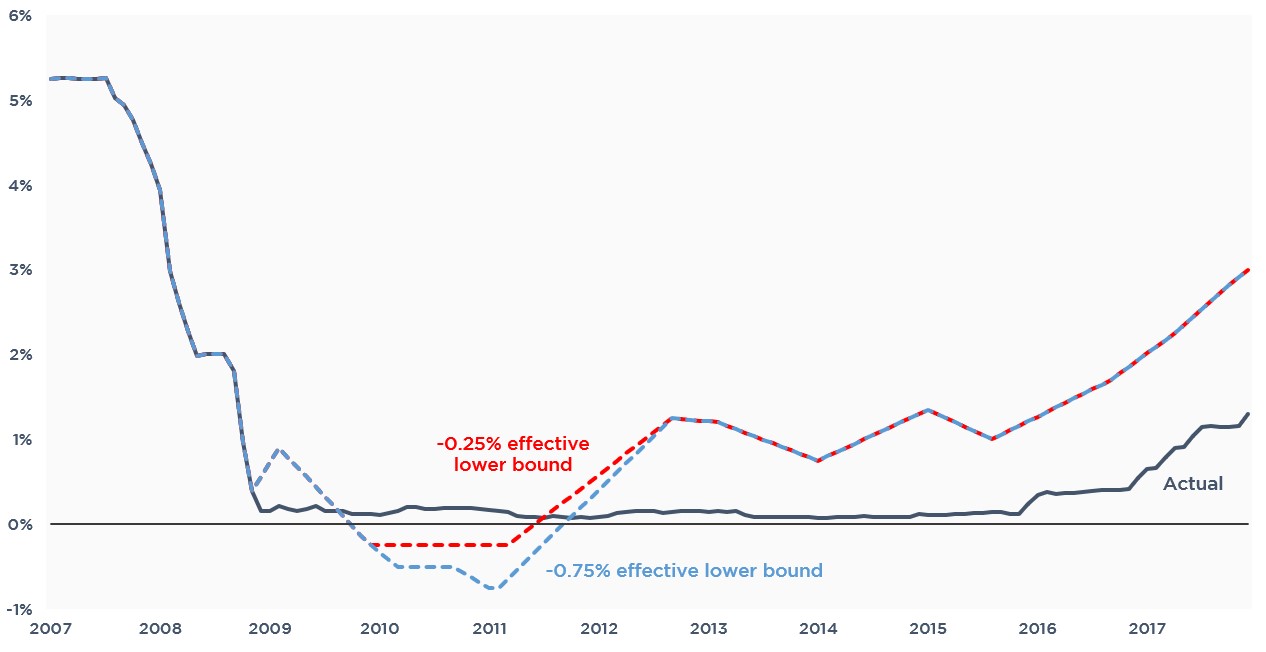
Which brings me to my favorite topic – negative interest rates! While I don’t think the Fed actually expects to take rates negative, they will want to convince the market they have that tool in their arsenal.
Don’t forget the Fed published a paper earlier this year illustrating that had they taken rates to -0.75%, the recovery would have been faster and stronger. Whether or not Powell actually believes that isn’t the point, the point is that the Fed is trying to convince the market it has about 3 more cuts available than it is being given credit for. Here’s the graph from that Fed article.
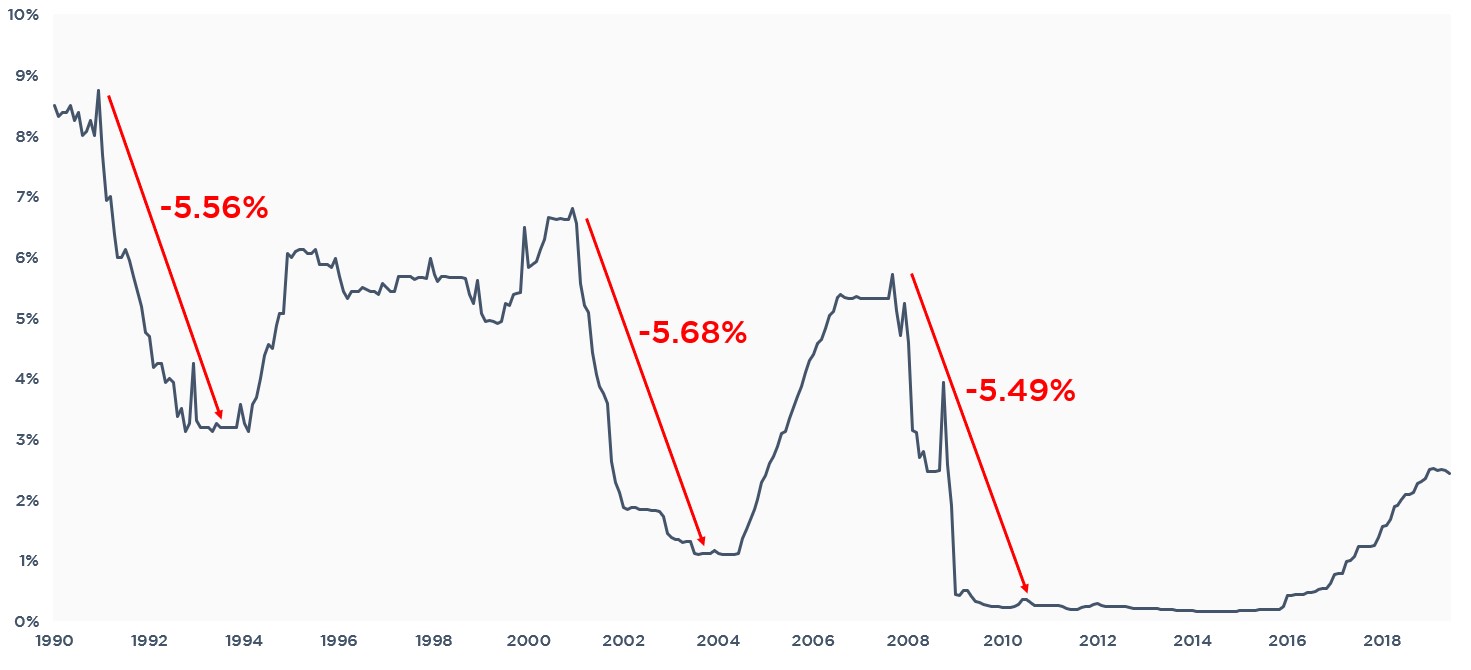
And why is that important? Because the market is concerned the Fed doesn’t have the necessary tools to cope with a downturn. During the last three easing cycles, the Fed cut rates by about 5.50% – regardless of the absolute level of rates.
This is the point where I start getting emails from readers claiming rates can’t go negative here. But if CPI is 1.8%, and the 10 Year Treasury is 1.55%, aren’t rates already negative?
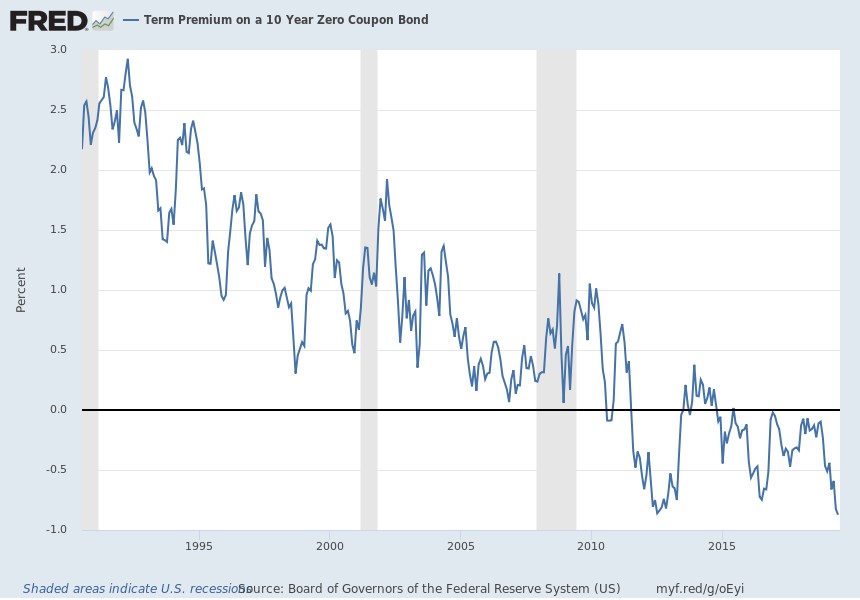
In fact, the Fed tracks term premium for 10 Year Treasurys. While there is some incredibly complex factors in this calculation, the intent is to measure returns accounting for inflation, risk, time horizon, etc. By the Fed’s own measures, the 10 Year Treasury term premium is negative 1.21%. In other words, current buyers of 10 Year Treasurys expect to earn an interest return of -1.21%. This is the lowest return on record.
This is a big reason why real estate continues to be in such high demand as an asset class – many of the alternatives are yielding negative returns.
This is also where I think real estate professionals may also be experiencing their own version of Saliency Bias, where we believe something to be true because it is happening to us. Because of massive liquidity, good deals are challenging to find, prices are crazy, etc. The market is hot and we aren’t seeing signs of a slowdown. Everyone I speak with sees nothing but strength.
But smaller tenants may not be feeling the slowdown yet, so they haven’t started the layoffs, holding off on expansions, aren’t delinquent yet, etc. And even if that starts happening over the next 18 months, real estate may still look like a good investment relative to the negative yielding alternatives. Therefore, absent a 2008 type crisis, those reading this newsletter may not fully feel the effects of a NBER-defined recession and believe the economy is still doing well.
This Week – Jackson Hole
Powell could use this as an opportunity to signal the market. Remember, the market puked over his comments about the cut last month being a mid-cycle adjustment and not the start of a full blown easing cycle.
Although Jackson Hole is usually more focused on academic discussions, Bernanke established precedent by twice referencing QE at Jackson Hole forums as a means of signaling the market.
If Powell’s comments are agnostic, or if he avoids the topic, markets will likely react negatively. There’s been another round of tariffs on Chinese goods, the ECB is about to go full dove, and Argentina could default by year end. He has plenty of cover fire to change his messaging from the last FOMC meeting.
And of course, the yield curve inversion. Powell has consistently dismissed concerns over an inversion because QE is distorting the shape of the curve. While that may be true, it takes a lot of chutzpah to dismiss a leading indicator that’s right as often as my teenagers think they are right.
If he dismisses talk of an inversion, the market will not be happy.