

For the first time in seven weekends, we are home this weekend. That means a few more graphs this week, but they are compelling. Fortunately, NMHC was a relaxing as ever and I got home totally refreshed...I decided to make a game of collecting branded lanyards. Berkadia must have been the headline lanyard sponsor, but each brokerage shop I spoke at gave me theirs, too. I decided to wear them all like I was running around Mardi Gras with brokers shouting, “Show your rates!”
Time for our annual Super Bowl Extravaganza! This one is quick and easy and focuses on fun questions. Winner gets eternal fame, losers get a toilet trophy and publicly shamed. Hey, if I can humiliate myself with interest rate predictions, you can do it for football. (LoanBoss SuperBowl Extravaganza)
Last Week This Morning
- 10 Year Treasury at 3.53%
- German bund at 2.21%
- 2 Year Treasury at 4.30%
- LIBOR at 4.57%
- SOFR at 4.56%
- Term SOFR at 4.57%
- Nonfarm payrolls came in at 517,000 vs expected 188,000
- Unemployment rate came in at 3.4% vs expected 3.6%
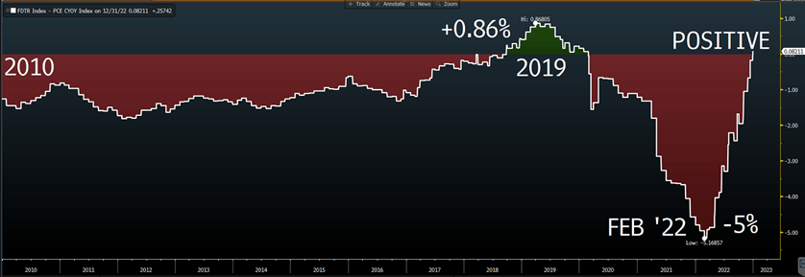
Real Rates are Finally Positive
We touched on this last week, but it bears repeating – real rates are positive for the first time in more than three years. From the Fed’s perspective, they are finally applying the brakes to the economy.
Nominal Rates – Inflation = Real Rates
Fed Funds – Core PCE = Real Fed Funds
4.625% - 4.40% = + 0.225%
Until unemployment is a problem, “real rates” will be the best predictor of monetary policy.
We don’t know exactly what the target is for “real rates”, but based on some of Powell’s comments I think it’s somewhere between 1.00%-1.50%. For illustration purposes, let’s assume it’s 1.50%.
Remember the equation from above:
Fed Funds – Core PCE = Real Fed Funds
- As the Fed hikes, the Fed Funds component goes up and Real Fed Funds goes more positive
- As Core PCE falls, the inflation component goes down and Real Fed Funds goes more positive
Whenever the Fed pauses, Core PCE will become the primary driver. I think the Fed will hike to 5% and pause. If that happens, here’s how Real Fed Funds would look.
5.0% - 4.4% = 0.6% Real Fed Funds
But Core PCE has been falling. It’s down 0.8% in the last four months, falling about 0.2% per month.
September 5.2%
October 5.0%
November 4.7%
December 4.4%
Let’s assume that pace continues, Core PCE would be 4% after the next Fed meeting.
5.0% - 4.0% = 1.0% Real Fed Funds
If Powell believes inflation will keep falling, he can pause at 5% and let the inflation component of the equation move us towards 1.50% naturally.
The Fed’s own projections put Core PCE at 3.5% at year end. That would translate into a 1.50% Real Fed Funds and Exhibit A why I think the Fed will pause at 5%.
Now imagine the Fed solving for a 1.50% Real Fed Funds by moving rates up and down to maintain that spread over Core PCE. Here are the Fed’s own Core PCE projections and the implied Fed Funds to achieve a 1.50% Real Fed Funds. This scenario would involve the Fed cutting rates 1.0% in 2024.
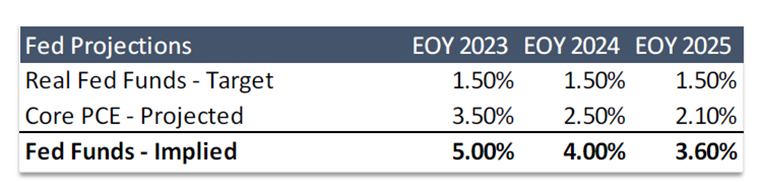
If the Fed cuts this year, it will be because inflation is falling faster than expected, not because the economy rolls over.
I started this section with “until unemployment is a problem.” With unemployment at 3.4%, the Fed has plenty of cushion baked into their labor mandate. Until inflation is beaten down, I think they’ll tolerate unemployment climbing towards 5% and focus exclusively on their price stability mandate (aka inflation).
Jobs
I’ve repeatedly stressed over the second half of the year to wait and see how resilient the labor market is after the start of the new year.
Welp, sh*t. Another great call…
The economy added a staggering 517k jobs last month vs an expected 189k. Unemployment dropped to 3.4%. Some skeptics would point out that the majority of the gains were in hospitality/service and part time jobs. Even more skeptical observers would note that the number of full time employees is actually down 10k from this time last year. Not me, though, I love reading no further than the headline and shouting ‘Merica!
But I also love confirmation bias as much as I love the Iggles, so I went to Google for some help. Bloomberg chief economist Anna Wong said about the job gains, “If it seems too good to be true, that’s because it is too good to be true — the gain is mostly due to seasonal factors and revisions to past data. The Fed likely won’t place too much weight on this report in formulating policy."
From the BLS itself, “Revisions due to both the NAICS 2022 conversion and the benchmark process affected more historical data than typical in the annual benchmark process.”
It would be impossible to argue this was a weak number, but I do suspect its not as strong as the headline suggests. More importantly, remember that the economy is always still adding jobs heading into the Fed pause. Job losses don’t usually start until after the Fed has started cutting.
“That JOLTS tho!” - everyone who believes inflation will keep running hot because there’s 1.7 job openings for every unemployed American. “Look at this graph! It screams inflation!”
In twenty years of doing this, the JOLTS survey has been cited about as often as the Cowboys win a playoff game. Now all of a sudden it’s Exhibit A for tightening monetary policy? The Phillips Curve died a slow death over the last 10 years, and yet suddenly it has been resurrected and held front and center? Is there some powerful Phillips Curve lobby I don’t know about?
If you really want to dig in, I would highly recommend this piece by Preston Mui (A Vacant Job Metric), but here are some of my subjective issues with this survey:
- Covid caused a legitimate shortage of labor, which led to employers posting lots of job postings to take whatever they could find. I suspect there are quite a few zombie postings.
- Online job postings have become incredibly cheap (or free), so there’s little incentive to take them down even if you aren’t really searching anymore.
- It doesn’t measure intensity. I could have 10 openings but haven’t interviewed anyone in a year.
- Measuring a “vacancy” is a muddier proposition than simply counting a layoff/hire.
- The response rate has plunged
“It is the JOLTS report that really caught my eye... JOLTS response rate has collapsed from 44% to 31% since 2021, at a time when job openings surged to 12 million from 7 million... How accurate is the surge in 5 million additional job openings, when there are 1/3 fewer respondents?" Fundstrat’s Tom Lee asked (he was JPM’s Chief Equity Strategist before founding his research firm) (How Accurate are Jobs Openings?)
Most importantly - if inflation continues to fall, do we really need 1.5 Americans to lose their jobs?
Isn’t there some chance that the covid snapback effect extends to the labor market and using traditional measures of labor to dictate monetary policy will lead to missteps?
What if we don’t need unemployment to climb in order to get inflation under control? Didn’t we experience that over the last decade?
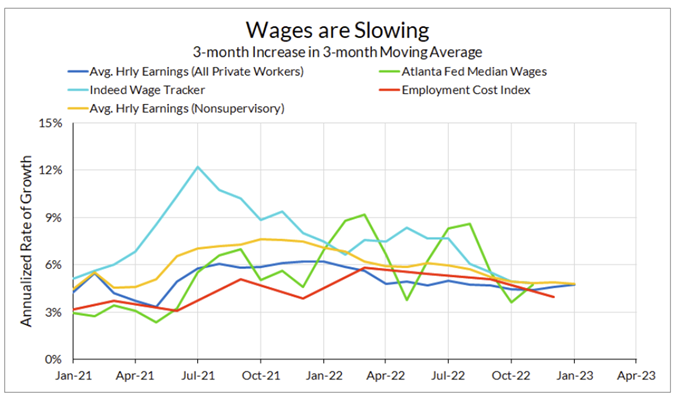
Average hourly earnings were up 4.4%, the slowest increase since August 2021. One year ago, wages were increasing at a 5.7% clip. And if you take the monthly number and annualize it going forward, its just 3.7%.
Employment Cost Index (preferred by most economists over average hourly earnings) came in at an annualized 4% and has slowed considerably over the last year.
Q1 2022 5.6%
Q2 2022 5.2%
Q3 2022 4.8%
Q4 2022 4.0%
January 2023 Labor Market Recap
I don’t think this report changes the timing of the upcoming Fed pause, but I do think it could change the market’s perception of cuts this year. This kind of number just proves the Fed has plenty of rope on the labor component of the dual mandate. This means they can hold higher for longer without unemployment spiking.
- If the Fed acknowledges JOLTS could be overstating the labor market strength, rates could fall
- If the Fed keeps relying on JOLTS, the odds of over-hiking will increase because the Fed is relying on a report I find suspect
Financial Conditions
But the market isn’t making it easy on the Fed to pause. My favorite graph of all time is starting to show up in mainstream media (finally!).
If Fed Funds is the input, Financial Conditions are the output. Pull a lever (rates), measure the impact (financial conditions).
Long time readers will know I usually label above the line as “Restrictive” and below the line as “Accommodative”, but I am going to tweak it this week to reflect the Fed’s perspective.
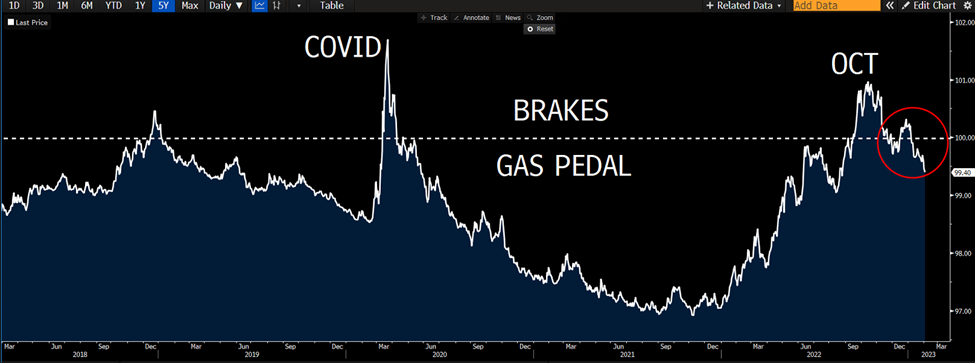
This is a big reason why the Fed will keep talking up “higher for longer” (and refuse to hint at cuts).
Someone Bet Huge That the Fed Will Cut Sharply This Year
The trading floor taught me that if you really want to test someone’s conviction, put money on it. A lot of blowhards clam up the minute you ask them to put their money where their mouth is. On LinkedIn a month ago, I offered up a $10k wager to an economist friend that said the Fed would be hiking to 7% (proceeds go to charity of winner’s choosing). Crickets. I know this will come as a surprise to you, but I was once of those blowhards. That lasted exactly one day on the trading floor.
It was after markets closed, and two very senior traders were arguing over who ESPN had named Top Athlete of the 20th century. One said MJ, the other said Babe Ruth. This wasn’t an argument over who they believed was the best athlete, but who ESPN had said was the best. There was a right answer.
I chimed in like an idiot, “It was MJ.” I was certain. I didn’t know either of them, but I knew I wasn’t supposed to be talking to them. As readers know, lack of expertise has never stopped me…
“Wrong,” trader that said it was Babe Ruth.
“No, it was MJ. 100%.” I was certain. I thought we were just bantering.
“Fine. $100?” he asked.
My 100% immediately dropped to 60%. This was my first day. I quite literally didn’t have $100, but I couldn’t show weakness twelve hours into the job.
“Done there,” remembering the lingo I had just learned a few hours prior.
The pucker factor was extremely high. I was no longer sure. I recalled Lee Trevino’s quote, “Pressure is playing for $5 when you only have $2 in your pocket.” Except I didn’t even have $2.
I immediately went to ESPN.com and prayed. I found it – MJ. I exhaled. I puffed up my chest and announced I was right. The trader came over, looked at my monitor, pulled out a huge roll of hundreds, and threw one on my desk.
I had won, but I learned to keep my mouth shut unless I was willing to bet on my conviction level.
At Wednesday’s FOMC meeting, Powell said, “We can now say for the first time the disinflationary process has started.”
Game on. According to Bloomberg’s Edward Bolingbroke, someone put $80mm on Fed cuts by December. On this trade:
- breakeven is Fed Funds at 4.2%
- Fed Funds at 3.8% would recognize a $100mm gain
- Fed Funds at 2.50% would recognize a $400mm gain
At least one trader out there is betting big on a big drop in rates later this year.
Cap Prices are Falling
It looks like cap prices are finally falling. Depending on the structure, prices peaked in Nov/Dec.
Here’s a $50mm 2% since the start of November. Note how the 2yr has dropped more because it picks up the falling forward curve resets.

By contrast, here’s a $50mm 5%, which has fallen off a cliff. A higher strike cap is benefitting more from volatility being sucked out of pricing as the Fed Pause becomes more certain.
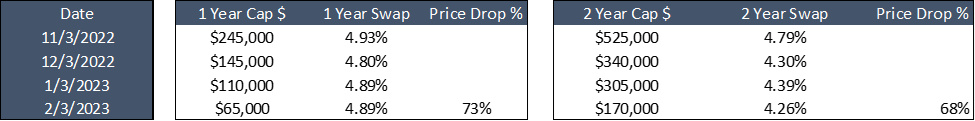
Deeply in the money caps will not fall as much, but will still fall (and have already 15%-20%). Newer, higher strikes have already plunged.
The market knows – once the Fed pauses, they are on the clock for the first cut.
Week Ahead
Numerous Fed speakers to clarify last week’s messaging, but honestly all I care about is the Eagles Super Bowl.