

Over the Thanksgiving break, I really took the time to think about all that I have to be grateful for – family, friends, health(ish), blah blah blah blah blah…
You know what I was thankful for the most? Upsets. Several teams that I hate, lost. Yeah, maybe I’m petty and immature, but at least I own it, right? Maybe it’s because my teams have done so poorly over the last month that I am lashing out and getting too much enjoyment out of other teams losing. Schadenfreude and whatnot. But it made the break that much more enjoyable.
THE Stephen F Austin State University. Or as I like to call it, THE U. The Lumberjacks marched into Cameron and beat #1 Duke! I had never even heard of SFA, so I looked it up on Wikipedia. Under the Notable Alumni and Faculty section, it only shows a pic of a pond and a building. Literally. No names, no graduates, not even a quasi-famous dropout! Again, this is under the Notable Alumni section! And they beat the Dookies!

Perhaps even more satisfying was the Cowboys loss on Thanksgiving day. The thought that 80,000 Dallas fans took the entire day to go watch their team get dropkicked, in person, just warms my heart. They could have been at home eating turkey and taking naps, but they drove to Jerry World to lose by 11. Delicious. And while I like Dak and know he will be torching the Eagles for the next decade, I really loved watching Zeke get spoon-fed a healthy dose of Buffalo wings stuffing. Feed him!
But perhaps I am most thankful for Jerry’s shocking patience with Jason Garrett, who I hope is still coaching the Cowboys a decade from now. Thank you, Jerry. You run the Cowboys like a very successful business, but a mediocre football team. You are the rich man’s Dan Snyder. I am forever grateful.
And with that, I will change into my elastic waistband sweats and let the Dallas hate mail pour in…
(I may have written that before the Eagles game on Sunday…karma waits for no one! Also, I may have bought the URL firedougpederson.com…)
Last Week This Morning
- 10 Year Treasury unch at 1.77%
- German bund unch at -0.36%
- Japan 10yr unch at -0.08%
- 2 Year Treasury mostly unchanged at 1.61%
- LIBOR at 1.70% and SOFR at 1.55%
- Q3 GDP was revised up to 2.1% from 1.9%
- Random thought of the day – if the Fed is cutting rates in a 2.0% GDP environment, what will it do when GDP contracts?
- Core PCE, Fed’s preferred measure of inflation, came in at 1.6% vs forecasted 1.7% and continues to miss the 2.0% target
- Durable Goods (think big ticket items) came in stronger than expected,
- Ole Miss WR Elijah Moore broke off a sweet turkey leg with a side of karma
Surprise!
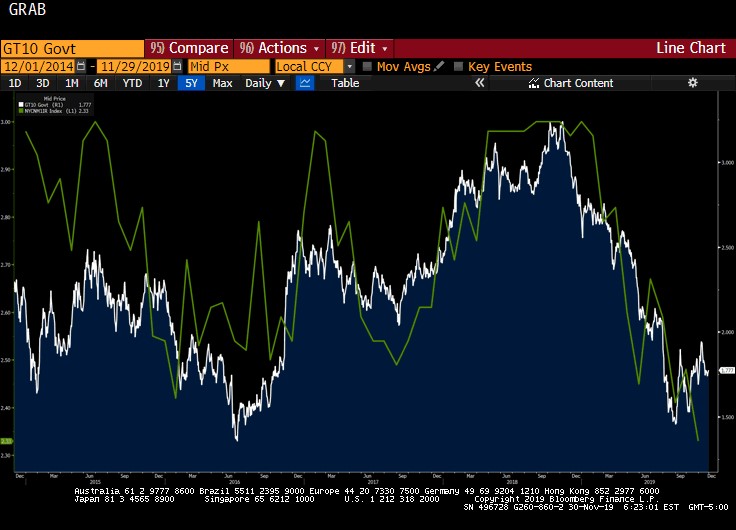
The Citi Surprise Index measures forecasted data vs actual data. In other words, how much of a “surprise” was the actual print?
One of the benefits of this index is that it does a decent job of highlighting periods of extreme optimism/pessimism. When data consistently surprises to the upside (like it is now), it suggests the market is too pessimistic.
In the Surprise Index graph below, the horizontal line represents no surprise – economic data is coming in exactly on top of forecasts. When the index moves above 0, it means that data is coming in better than expected. When the index moves below 0, it means that data is coming in worse than expected.
The green line is the 10 Year Treasury. Notice how sharp rate movements are usually preceded by a divergence between expectations and reality.
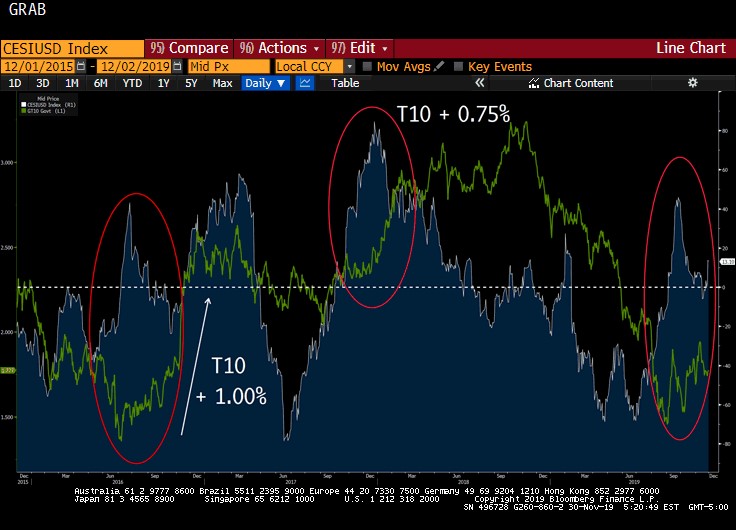
Think of the 10 Year Treasury as a gauge of market sentiment. When it diverges from the actual data, it could be front running the expected changes to the economy on the horizon. Or, it could just be overreacting.
In the last 18 months, the data has largely been coming in worse than expectation. The 10T grinded lower as the data kept missing forecasts. Pessimism begets pessimism.
Over the last few months, however, the data started coming in better than forecasted. That’s the red circle on the far right. That would suggest the 10T should move up, but it hasn’t. This is potentially setting the stage for a move higher in long term fixed rates.
Over the last four years, there have been two periods when the 10 Year Treasury was depressed relative to the Surprise Index. Eventually, the market threw in the towel and the 10T spiked around 1.00%. Today’s market pessimism could be setting the stage for a correction in rates.
The cynic in me highlights two contributing factors to those time periods when rates spiked:
- The first jump was immediately following the 2016 election, so that movement was affected by many more factors than just the Surprise Index.
- The 2017 spike could be related to the tax cuts, not just surprisingly strong data.
Long time readers of this newsletter know that I firmly believe we are in a low rate regime for the foreseeable future, maybe the rest of my life.
But I am also a big believer that market sentiment can change quickly. Think about how impactful Fed-speak has been on the economy the last year. The Fed’s three rate cuts in the last six months removes one of the two biggest risks to the economy off the table. “Hey, the Fed isn’t hiking us into a recession – it’s ok to take some risk!”
Monetary policy also contributes significantly to how tight/loose financial conditions are. You’ve seen this graph a million times by now, but it’s really important and highlights how Fed policy impacts our universe.
The Fed has been easing financial conditions all year, and the economic data just recently started to surprise to the upside. Isn’t it possible the market simply hasn’t woken up to the fact that the data is still showing surprising resiliency? Maybe it’s waiting for the other shoe to drop that isn’t actually about to drop?
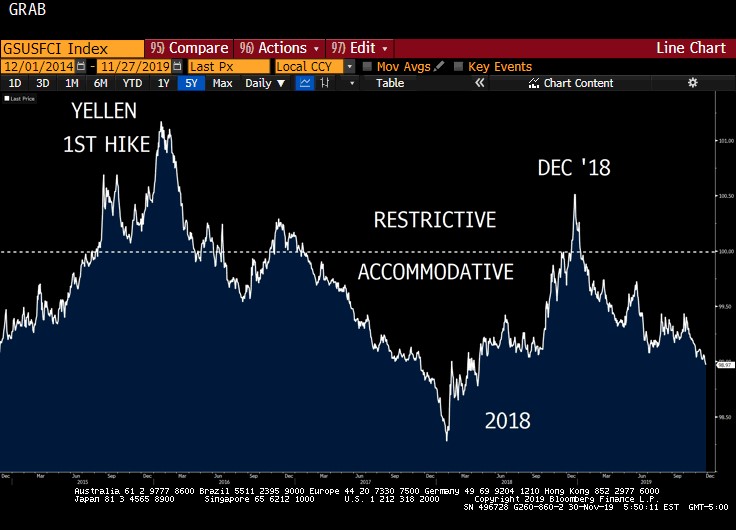
It’s challenging to be in a recession with financial conditions this accommodative. That doesn’t mean conditions can’t change quickly, but usually it takes at least a year to enter a recession with financial conditions as loose as they are right now.
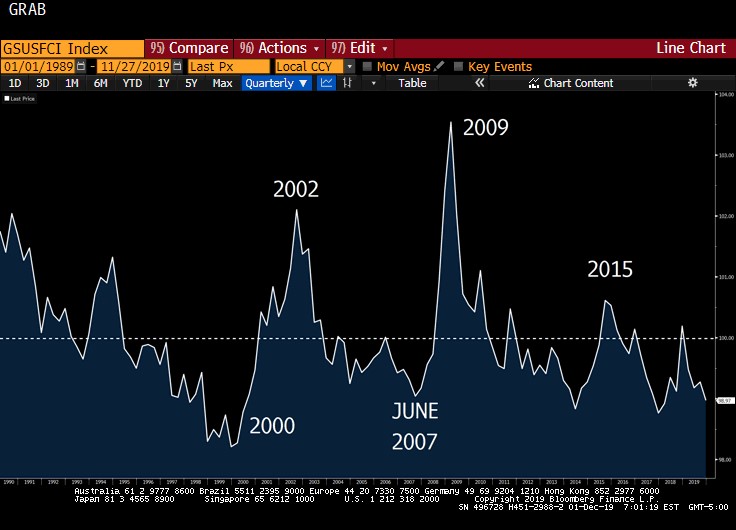
Here’s financial conditions during the last two downturns. Accommodative a year before the recessions, and then conditions deteriorated rapidly. Again, the takeaway here is that it would be challenging to be in the midst of a recession today given how accommodative conditions are right now.
Now let’s look at financial conditions with the 10T overlaid (green). Notice the nice inverse correlation – when conditions are accommodative, the 10T jumps. The last time financial conditions were this accommodative, the T10 was above 3.00%.
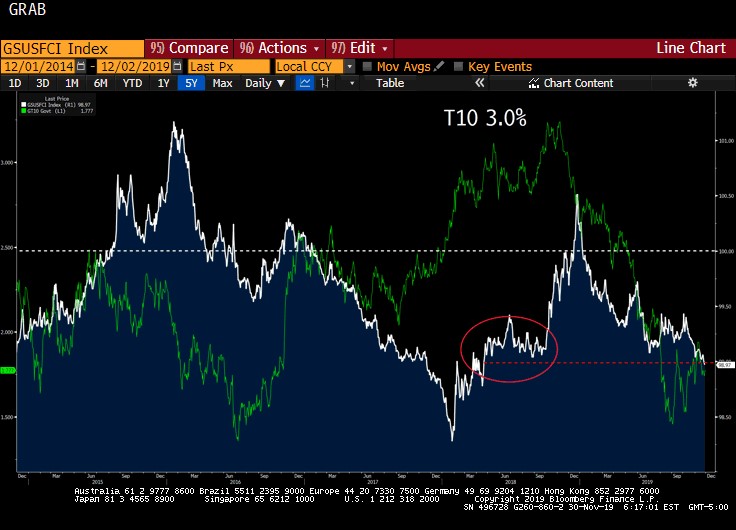
Intuitively, this makes sense. If financial conditions are tight/restrictive, the markets turn pessimistic, expect an economic downturn, and there’s a flight to safety – the T10 goes down. The opposite is true when things are going well.
Is it impossible to conceive a scenario where this sort of accommodation gives the T10 room to move higher? Accommodative Fed, resilient GDP, full employment, etc… I’m not saying long term rates are going up, I’m just saying there are reasons why they could.
Remember, the Fed cutting short term rates actually set the stage for higher long term fixed rates.
Throw in a real deal with China, maybe the threat of inflation (Tax Cuts 2.0?), and there is a scenario where the T10 runs up to 2.50%.
But Not So Fast My Friends
But there is one huge difference between those scenarios I highlighted earlier and today’s environment. And it isn’t China, or an impeachment, or even a manufacturing recession. It’s inflation. Actually, inflation expectations. The market is forward looking, after all. It cares more about where inflation is heading than where it is today.
In the graph below, the T10 is the shaded blue. Forward inflation expectations are the green line. Even this state school kid can detect a hint of correlation in the graph below. In both the time periods that data surprised to the upside that we highlighted earlier, the market was projecting inflation around 3.00%.
Surprisingly strong data plus inflation expectations conspired to spike rates. We don’t have the same inflationary expectations today.
I cannot stress this enough – inflation expectations are one of the biggest drivers of the 10 Year Treasury yield.
If you believe inflation is coming, you also believe higher rates are on the horizon.
Anything that would cause inflation expectations to rise could be the catalyst for a sustained movement higher in rates. Stimulus package, tax cuts, infrastructure bill, CPI/PCE moving up, etc.
With accommodative monetary policy, resilient GDP, full(ish) employment, and a potential resolution with China, it feels like the market is coiled, just waiting for an excuse to send rates higher.
Alternatively, lack of inflation expectations would really keep a lid on yields even with all those other pieces of good news. That’s why a deal with China may cause a temporary jump in rates, but the move will be limited without a corresponding rise in inflation expectations.
This Week
Friday’s jobs report and inflation expectations will be the significant data points, but obviously China headlines will continue to dominate.