

Let’s not pretend I care about interest rates this weekend, shall we? But rather than take the week off, I will cheat and rely on graphs to largely write the newsletter. It actually turned out better than most newsletters, which probably tells me something about my writing style…
Last Week This Morning
- 10 Year Treasury back up to 3.74%
- German bund at 2.36%
- 2 Year Treasury at 4.53%
- LIBOR at 4.58%
- SOFR at 4.55%
- Term SOFR at 4.56%
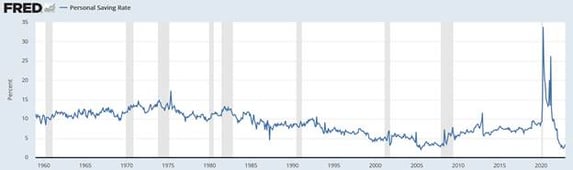
The Disinflation Process Has Begun
Powell has replaced, “Inflation is transitory” with, “The disinflation process has begun.” He has said it enough that it’s intentional. This is a signal that end of hiking is approaching.
We get CPI on Tuesday and to say it’s an important number would be the understatement of the week. We’ve had six consecutive monthly declines and headline CPI is expected to come in at 6.2%. That would be a decline of 3% in 7 months. The disinflation process has begun.
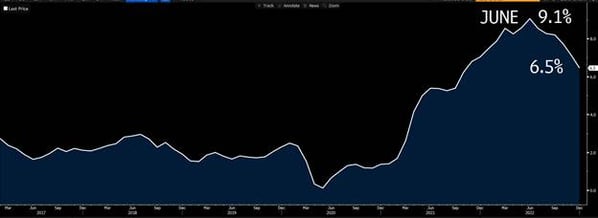
Source: Bloomberg Finance, LP
I expect a growing narrative in the first half of this year: the first 3% drop was much easier than the next 3% drop.
The Fed will use this as a reason to keep rates elevated for longer. I continue to believe the Fed will keep rates above 5% for all of 2023 unless inflation falls faster than expected. They will not cut due to economic pain alone.
With that in mind, let’s talk about why I think inflation may fall faster than expected.
Money Supply (M2)
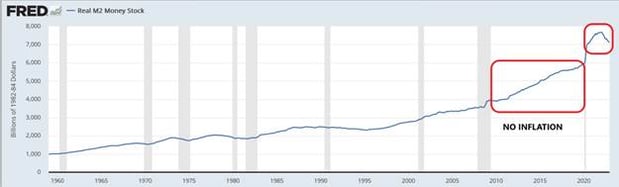
Post-pandemic, lots of people pointed out that M2 surged and that must increase inflation, but I countered with, “How come it didn’t in the 10 years after the financial crisis?” I still believe this to be true.
But even if you believe M2 = inflation, take a look at the downturn we are experiencing right now. Please point to any other time in history where it is dropping like it is right now.
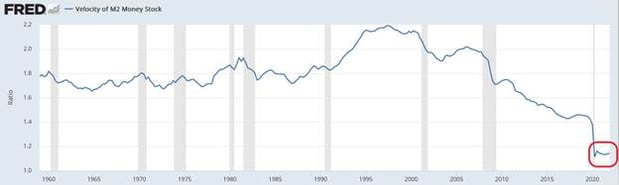
Velocity of Money
More important to inflation is the velocity of money, eg how often does a dollar exchange hands? All throughout 2021 I was pounding the table saying, “You can’t have inflation if money isn’t exchanging hands.” I’ve highlighted velocity as of 12/31/21. This was Exhibit A in why I didn’t see inflation coming in 2022.
You can probably guess what happened next. Here’s velocity in 2022. Ouch. Velocity = Inflation.
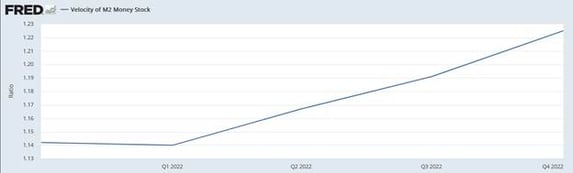
What causes a change in the velocity of money? The primary driver is consumer spending.
To predict inflation going forward, ask yourself this: “Do you expect consumers to keep spending at the pace they have been spending?”
If yes, then inflation will persist. If not, then it will fall.
I believe velocity surged in 2022 because the pandemic lockdowns, and the associated fiscal and stimulus policies, created excess savings.
There was nothing to spend money on (other than hand sanitizer and toilet paper) through much of 2021, so savings spiked to all-time highs. It then plunged as consumers shifted gear into spending mode. Spending = velocity.
Flush with cash and supply chains snarled with logjams, spending and prices surged in 2022. Whenever that money runs out, we should see a slowdown in spending. That, in turn, translates into a slowdown in the velocity of money.
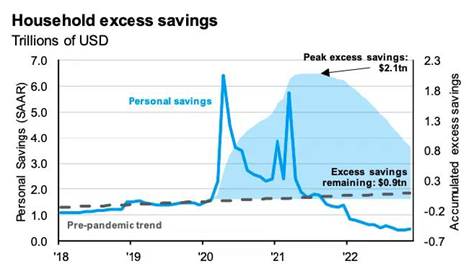
So when will consumers run out of their excess savings?
They mostly already have. Here’s a JPM graph illustrating how excess savings have fallen off a cliff.
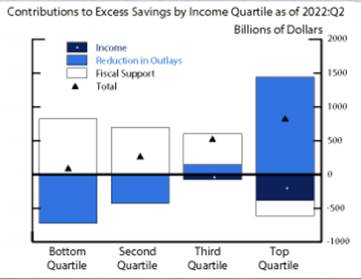
Here’s a graph the Fed put together showing that the bottom 50% of Americans have already blown through their excess savings and the 75th percentile are almost there. Oh, and this is as of June last year. I bet consumers haven’t rebuilt their savings since then.
While the job market is strong, the psychology of spending remains strong. “I’ve got a job and I could get a different one if I needed to. I can keep buying stuff and taking trips.” Because they haven’t changed their spending habits yet but they’ve run out of savings, they are shifting to credit cards to support spending.
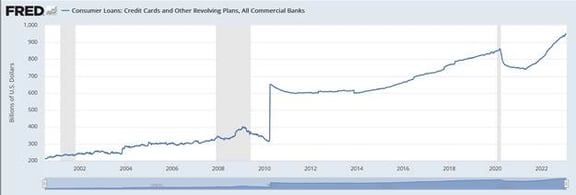
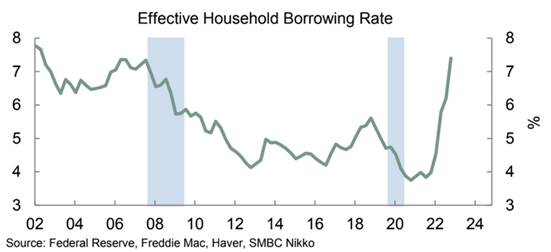
SMBC put out a research piece this week highlighting the surge in the consumer effective borrowing rate to 7.4%, the highest since 2002.
If consumers have spent their excess savings and are now shifting to credit cards, and that borrowing rate has surged, how long before consumer spending rolls over?
Oh, and consumer spending comprises over 2/3rds of GDP…
Powell is right. The disinflation process has begun.
Floating Rates (and Caps)
The jobs report forced the market to acknowledge the Fed might keep rates north of 5% all year, which in turn drove up the front end of the curve, which in turn pushed cap prices back up.
I don’t think last week’s gain of 517k jobs means the Fed will hike in May. I think that will be determined by what inflation does between now and then.
In the last three months, Core PCE has fallen from 5.1% to 4.4%. If that pace continues, it will be sub-4% by the May meeting and I don’t think they hike.
But in the near term, the strong labor report put upward pressure on front end rates and that will temporarily reverse the 60 day trend of falling cap prices.
The job report also gives the Fed cover fire to keep talking up elevated rates, even if that ultimately doesn’t come to pass. There’s basically no downside right now to keep saying they might go higher than expected.
Week Ahead
One thing and one thing only.
