

I could have held off and sent this Tuesday since markets are closed today. But with the hapless Eagles playing tonight, I wanted to get this out of the way so I didn’t have to address their poor showing. By this time next week, their absurd end to the season will be a distant memory and I can mock the Cowboys instead.

Here's my AI interpretation of Dak, McCarthy, and the next HC of the Cowboys, Bill Belichick.
Last Week This Morning
- 10 Year Treasury at 4.05%
- German bund at 2.18%
- 2 Year Treasury at 4.39%
- SOFR at 5.32%
- Term SOFR at 5.34%
- Headline jobs data looked strong, but the underlying details paint a different picture
The Fed Could Cut in March, But Why Would They?
Futures markets put an 81% chance of a cut in March.
Odds of no cuts by June? 0%
Odds of FF > 4.50% at year end? 0%
As much as I believe the Fed needs to and will cut this year, this feels overdone to me.
We are just two months away from the March 20th FOMC meeting. That means we get two more Core PCE reports and two more labor reports. Will those be so negative that the Fed cuts? I’m skeptical. A cut in March is on the table, but 81%?
The moment the Fed starts talking about cuts, financial conditions ease. Front end rates collapse. Stocks to the moon. If you’re fighting the fear of inflation, don’t you hold off as long as possible before opening that can of worms?
I think a cut in March is the best way to achieve a soft landing, but I think the Fed will hold off until June.
10 Year Treasury
The current Range is 3.94% - 4.05%
Key technical resistance levels
Downside: 3.68% and then 3.25%
Upside: 4.36% and then 4.70%
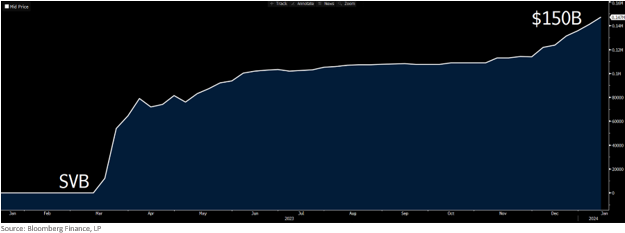
Bank Term Funding Program
Big banks are fine, but I’m less sure about the regionals. CRE risk and Treasury holding MtMs are a few of the risks the Bank Term Funding Program has covered up.
Roughly speaking, a 10yr Treasury bond bought with a coupon of 1.50% had lost 16% of its value by the time SVB closed. The Bank Term Funding Program said, “No sweat, give us those Treasurys and we will give you back face value.” A $1mm Treasury bond was worth $833k, but the program gave them $1mm cash and took the Treasury as collateral.
This shored up the balance sheet and discouraged a run on regional banks like SVB. Rates kept climbing, compounding the unrealized losses. The $833k value fell to $750k. If you had only posted some of your Treasurys, why not post more? “I’d like a 133% LTV loan please.” No problem, but we’re sending our auditors to stalk the hallways of banks to make sure they are only doing 50% LTV loans.
In the fall I wrote that there would be three potential outcomes:
- Everything is fine. The banks return the cash and take back the Treasurys. “Thanks for the year cushion to figure our stuff out.”
- Rates fall, lessening the pain from the lost value. But with the Fed talking up “higher for longer”, it would take a Fed pivot for rates to fall materially.
- The program is extended.
The 10T was 3.70% before the collapse. At 4% today, that means a 10yr Treasury has lost about 2.5% since SVB went under. If that’s not manageable, we have cracks in the regional banking sector. $150B in cash to be repaid all at once feels significant. Even if that happens, what’s the impact on liquidity? Lending?
Oh, and if your position is they are just gaming the system I’d ask, “why is the Fed allowing that?”
The program expires in March.
The Curve is Un-Inverting
20 and 30 year Treasury yields are now higher than 2 year Treasury yields. Here’s the spread between the 30T and 2T. I’ve included the dates when the curve uninverted and the red circles are the start of the recession. As you can see, the curve uninverts and the recession follows.
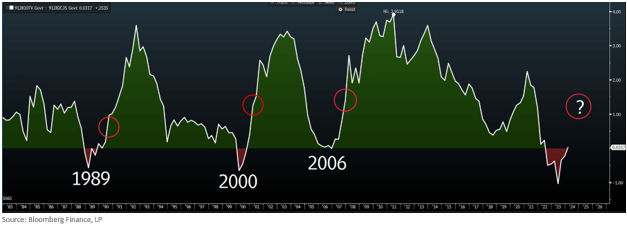
The more traditional measure of yield curve steepness, 2s/10s, probably won’t uninvert until the Fed is actually cutting. It’s been 18 months since the curve inverted. Guess how long the average amount of time is between inversion and recession?
18 months.
The Week Ahead
This week will be slower as markets digest the inflation reports and look out for more clues as to when the Fed will begin cutting rates. There are several Fed speeches because next week the Fed will enter the dark period ahead of the meeting on the 31st.