

I had a drill sergeant that would stalk the aisles of the barracks barking, “The beatings will continue until morale improves.” This was usually while we were in the front leaning rest position. The military, it would seem, is not without a sense of irony.
San Francisco Fed President Mary Daly made headlines this week when she said more hikes would be needed to drive inflation down to 2%. Like me, she isn’t a voter on monetary policy this year. Unlike me, she has a PhD in economics and a 30 year career at the Fed, so markets tend to listen to her.
What I found most interesting about these comments was that she said them after Core CPI m/m posted the smallest back-to-back monthly increases in over two years. Both months showed 0.2% increases, which roughly translates into 2.4% y/y. A year ago, monthly Core CPI was 0.6% (7.2% annualized).
I thought you guys were data dependent?
Despite continued positive news around inflation, President Daly is stalking the halls of the SF Federal Reserve barking, “The tightening will continue until morale improves!”
Last Week This Morning
- 10 Year Treasury at 4.16%
- German bund at 2.63%
- 2 Year Treasury at 4.90%
- SOFR at 5.30%
- Term SOFR at 5.31%
- Student loan repayments begin in October, with an average $350/mo going towards debt service instead of something else. That amounts to about 0.25% of GDP. It’s not a crippling number, but it’s not nothing, either.
Inflation – Data Dependent?
“Inflation is always and everywhere a monetary phenomenon, in the sense that it is and can be produced only by a more rapid increase in the quantity of money than in output. Also, Go Birds!” Milton Friedman.
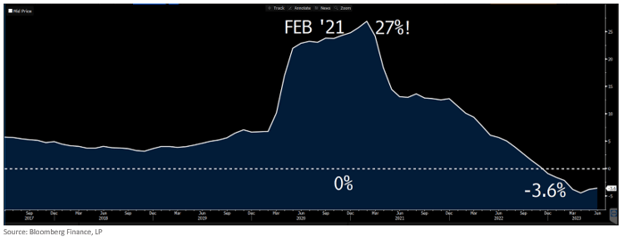
M2 as % change peaked at 26.9% in February 2021 when CPI was a quaint 1.7%. That’s not a typo. 26.9%!
CPI peaked 16 months later at 9.1% when M2% was down to just 5.5%. 16 months is quite the lag.
M2 contracted for the first time at year end 2022. Today, it is -3.6%.
I’m going to show you both together, but for some perspective here is M2% y/y by itself.
Here they are together to help illustrate the lag effect.
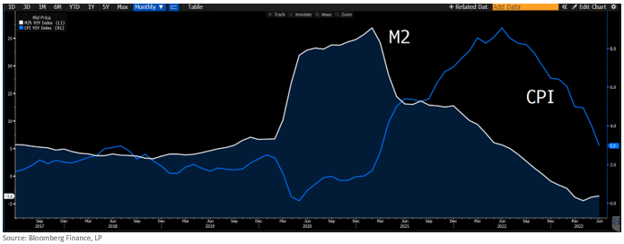
As we discussed last week, CPI y/y increased slightly as the result of base effects. But the month over month number held firm at 0.2%. More importantly, progress is being made on nearly all fronts except one – and that one has a notorious lag.
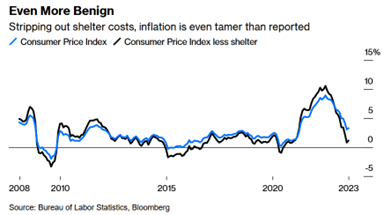
“The core consumer price index rose 0.2% for a second month, according to Bureau of Labor Statistics data posted Thursday. More than 90% of the rise in overall CPI was due to housing expenses,” according to Bloomberg. (Housing is Fed's Secret Weapon)
“A recent report from the Federal Reserve Bank of San Francisco suggests that shelter-cost inflation peaked around April at around 10% on a year-over-year basis. As more leases turn over that rate should continue to drop through the rest of this year and into 2024, reaching zero in May, according to the report. Indeed, more timely data from private sector sources such as Apartment List already show a year-over-year decrease in rents,”
Did you happen to notice which Fed branch that report originated from? San Francisco! Mary Daly!
“Our baseline forecast suggests year-over-year shelter inflation will continue to slow through late 2024 and may even turn negative by mid-2024,” San Francisco Fed economists Augustus Kmetz, Schuyler Louie, and John Mondragon wrote in a note published Monday. “This would represent a sharp turnaround in shelter inflation, with important implications for the behavior of overall inflation.”
I thought you guys were data dependent?
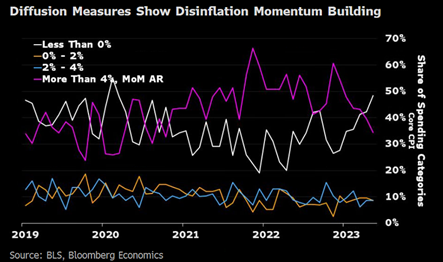
Bloomberg also has a Diffusion Index that tracks inflation across buckets, from 4%+ to negative.
- the purple line reflects prices still increasing more than 4% - down from 60% to 30% since the end of 2022.
- the white line reflects prices falling (not just slowing, but actually falling) – up from 20% to 50%.
And while they probably want to avoid chatter about cuts, I’m not sure more talk of hikes is needed to keep the positive momentum around inflation expectations. Things are trending in the right direction:
- market expectations (via breakeven rates) for 1 year inflation has fallen from 3.7% to 1.55%
- consumer expectations for inflation have fallen from 5.4% to 3.3%
- China CPI has fallen from 5% to -0.3%, while PPI has fallen from 13.5% to -4.4%
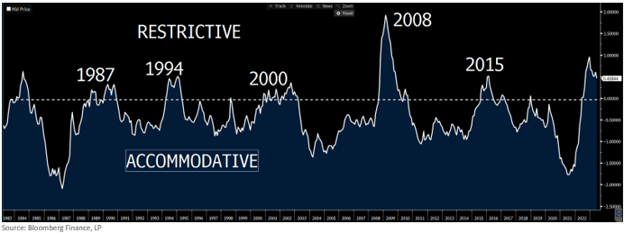
Even if the Fed pauses, financial conditions will naturally tighten as/if inflation recedes. Even though conditions have eased slightly since SVB, we are still at historically tight levels (exceeded only by the financial crisis).
Markets have 90% odds of no hike on September 20th, but 31% odds of a hike at some point before year end.
I’ll be interested to see how Jackson Hole plays out in two weeks. Will the Fed suggest a pause and evaluation?
Or will the tightening continue until morale improves?
10 Year Treasury
The key 3.92% threshold on the 10T has been broken for two weeks now, increasing the odds of a new range. 3.92% becomes the floor, and 4.25% is the ceiling.
Bloomberg rates strategists are still calling for a 3.32% year end 10T and point out the current yield is more than 2 standard deviations above fair value.
Week Ahead
Quiet week ahead on the data front, but we do have some Fed speeches and the minutes from the last meeting.