

It brings me an embarrassing amount of joy that the Cowboys are keeping McCarthy. Jerry Jones is the greatest GM in the NFL as long as you hate the Cowboys. For a man that made his fortune taking reckless gambles, his coaching decisions are extremely conservative. He’s making decisions to avoid being bad rather than swinging for the fences. As an Eagles fan, this is fantastic. The Cowboys can’t win a Super Bowl as long as he’s in charge. I can deal with double digit win seasons as long…
(phone rings)
…hold that thought, excuse me.
“Hello?”
(unintelligible garble)
“Who was that?” Sarah
“Michigan and Ohio State fans.”
“What’d they want?”
“Wrong number I think. They kept asking for James Franklin.”
Last Week This Morning
- 10 Year Treasury at 4.15%
- German bund at 2.30%
- 2 Year Treasury at 4.41%
- SOFR at 5.31%
- Term SOFR at 5.34%
- Hawkish Fed-speak:
- Waller: “With economic activity and labor markets in good shape and inflation coming down gradually to 2%, I see no reason to move as quickly or cut as rapidly as in the past”
- Bostic: expects policymakers to start cutting rates in the third quarter of this year
- Michigan Consumer Sentiment report exceeded expectations, likely coinciding with the lowest inflation expectations in years
- ECB President Lagarde said she expects to cut rates in the summer
- Germany is officially in a recession
Core PCE - Friday
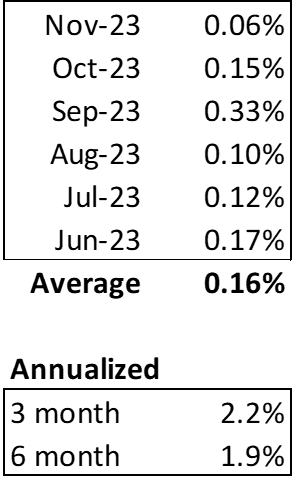
Friday’s Core PCE is the biggest data point this week. Consensus forecasts are for 3.0%, the lowest print since March 2021. Core PCE has been dropping at about 0.2% per month the second half of 2023. Should that pace continue, that would put the Fed’s preferred measure of inflation at 2.4% by the end of Q1. That print won’t be out until after the FOMC meeting on March 20, so Friday’s number and February’s will be the final Core PCE prints to dictate the March decision.
More importantly, monthly inflation is already annualizing at 2%. Economists tend to look at 3 and 6 month averages. Here’s monthly Core PCE since last summer.
Penn State’s Alternative Index, which purposely addresses the lag in the shelter component, has been sub-2% for two months.
And the New Tenant Rent Index is deeply negative.
I see three scenarios for inflation this year.
Reach/Break through 2%
Odds: 50%
Inflation always moves more than we expect, why should this time be any different?
We’ve made all this progress without a recession or unemployment surging, what will inflation do if either/both of those materialize?
Last Mile
Odds: 50% 40%
Inflation levels off and perhaps even inches back up a little bit. Stabilizes in the 2.5%-3.0% range. The Fed expends a lot of energy convincing the market we can tolerate inflation over target and it will take a while to reach 2%.
Reaccelerate above 3%
Odds: 0% 10%
I learned my lesson after declaring “inflation isn’t a thing anymore” in 2020, but I just don’t see this happening. If you disagree, you’re probably over 60 or hate math.
Fed Funds
I don’t think it’s a coincidence the Fed-speak last week drove up rates and backed out odds of a March rate cut. The Fed goes quiet the week ahead of an FOMC meeting, so they can’t say anything this week. Last week was their last chance to persuade the market it is pricing in cuts too early.
Rate Cut Odds
March cut: 50%
Cut by June: 99.4%
FF > 4.5% year end: 5%
FF < 4.0% year end: 45%
I still think the first cut comes in June coupled with some sort of autopilot language to avoid the appearance of influencing the election. Cut 25bps per meeting, each meeting, through year end. That’s 5 cuts, 1.25%, putting Fed Funds at 4%-4.25% in December.
Treasury Yields
We broke through the 4.05% ceiling, establishing a new range higher. This may be a temporary move, however, should this week’s inflation data reinforce the move lower.
The historical spread between Fed Funds and the T10 is 1.40%. If the T10 is at 4.00%, that implies the market thinks Fed Funds will average 2.6% over the next 10 years. That is an insanely oversimplistic explanation, but that’s a state school education for you. In this context, you would only expect the T10 to move lower if the market thinks Fed Funds is headed below 2.6%.
The graph below highlights the last three easing cycles. Once the markets pivoted to cuts, the 10T behaved oddly similar in each cycle over a 12 month period. In each instance, the 10T dropped about 1.50% from the peak
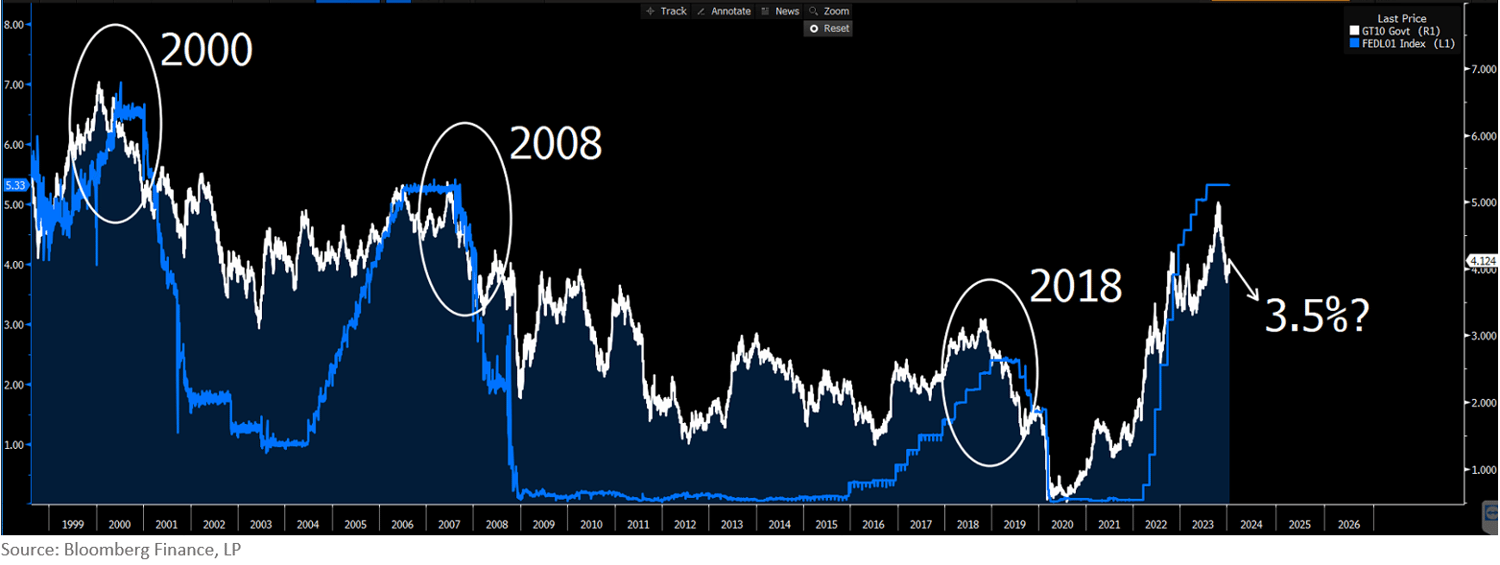
With a peak in October of 5%, that puts the 2024 low around 3.5%.
Obviously, extending that time period beyond 12 months pushed yields much lower. But if you are pricing fixed rate debt in 2024, I would be careful about assuming the 10T will drive to 3% once the Fed starts cutting.
That could happen, but only if the market expects the Fed to have to cut more than the 6 cuts priced in currently. Most of the 1.50% move has already happened.
The Week Ahead
GDP on Wednesday and inflation on Friday. Buckle up.