

Last Week This Morning
- 10 Year Treasury at 4.54%
- German bund at 2.64%
- Japan has changed the 1.00% upper bound on its 10yr yield from a hard cap to a reference
- 2 Year Treasury at 4.84%
- SOFR at 5.32%
- Term SOFR at 5.33%
- Jobs report was disappointing
- Maersk is cutting at least 10,000 jobs as shipping demand plunges
Those Jobs Tho!
Jobs came in weaker than expected, with a 150k gain. The number would have been about 33k higher if not for the UAW strike. The prior two months were revised down by 101k jobs, resuming that interesting pattern of “here’s a strong number and pay no attention to the revisions to last month!”
Without the known fudge factors, we would have experienced job losses last month. Birth Death adjustments continue their suspicious upward trend. Remember, this is the government’s estimate of jobs created out of the “birth or death” of businesses…but it’s a total guess. Is it weird to anyone else that this fudge factor keeps going up month to month? We are becoming overly reliant on this estimate to maintain positive job gains so the headlines can scream “tight labor market!”
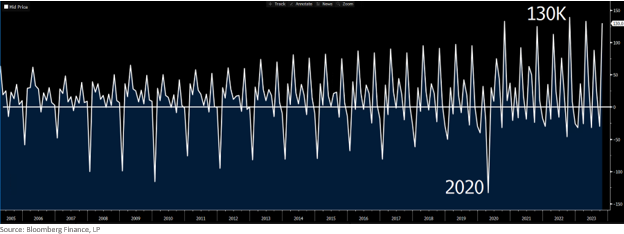
Americans holding multiple jobs surged 396k and stand at an all-time high of 8.5mm. Long term unemployment (greater than 6 months) is up 500K+ over the last six months. Quit rates are back to pre-pandemic levels. Average hourly earnings are annualizing at 3.2%. The twenty year average is 3.0%.
Remember when we talked about the Sahm Rule, named after Fed economist Claudia Sahm? She found that when the three month moving average unemployment rate climbs 0.5% off the prior year low, a recession ensues 100% of the time.
We bottomed out in April at 3.4% and Friday’s print was 3.9%. It hasn’t technically been triggered because the three month average is 3.83%, but we are knocking at the door.
As a friendly reminder, the unemployment rate is a terrible leading indicator! It starts climbing right before the start of a recession and then peaks after the recession is over. The entire financial system collapsed in October 2008 and unemployment didn’t peak until a full year later!
This graph shows unemployment with the start of recessions highlighted. I bet there were a lot of “tight labor market” comments in those troughs right before unemployment surged.
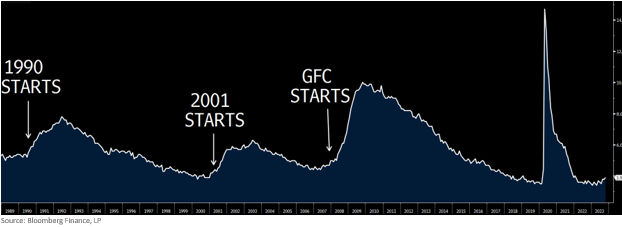
There is nothing unique about this labor market. Jobs are behaving the way they always do. The losses will start some time next year, but unemployment probably won’t peak until 2025.
What Rate Cuts in 2024 Might Look Like
Now that we know the Fed is done hiking…
The longest the Fed has ever gone from pause to cut is 15 months. If Since July was the last hike, that means October 2024 would match the longest pause on record. If they don’t cut in 2024, it will be unprecedented. Remember, Powell said the Fed won’t wait for inflation to be at 2% before cutting. It just needs to see credible evidence that core inflation is moving to 2%.
Odds of a Dec hike are just 7%. Odds of another hike at any point are just 12%.
Scenario 1 – One lonely cut in December
Excess savings extends the runway through the first half of next year. The labor market does what it always does and doesn’t start posting actual losses until the middle of 2024, misleading everyone into believing this time is different. Core inflation moves lower but at a painfully slow pace.
The Fed holds off on cuts until December to get on the other side of the election, fully intent on avoiding the mistakes of the late 1970s. Fed Funds finishes 2024 right around 5%. Caps stay expensive for most of the year and transaction volume is very low.
Likelihood of this scenario: 20%
Scenario 2 – Waits too long, cuts more than it would have otherwise needed to
If the Fed can repeat the mistakes of the past, I can end a sentence with a preposition if I want to.
The rest of the economy starts feeling what the real estate market has been feeling for a year. Unemployment surges north of 5%. Consumers fall further and further behind on debt payments. The market starts pricing in 2% of rate cuts even as the Fed pinky swear promises this time is different.
The Fed starts cutting in the second half of the year, but the damage has been done. The economy is in a downward spiral heading into an election and a WH IP address experiences the most Google searches for “Can I fire a Fed chair?” since 2018.
Fed Funds finishes the year sub-5% but is in a free fall towards 3%.
Likelihood of this scenario: 50% because this is what always happens
Scenario 3 – Peg Fed Funds above core inflation
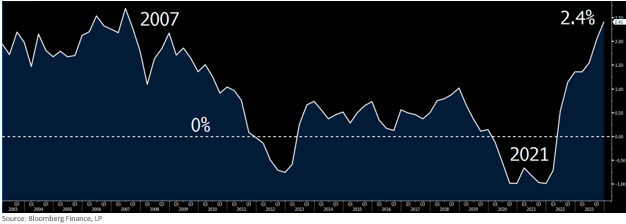
Economists measure “real rates”, which are rates adjusted for inflation. When real rates are negative, conditions are accommodative. When real rates are positive, conditions are restrictive.
Said another way, positive real rates are like applying the brakes to the economy.
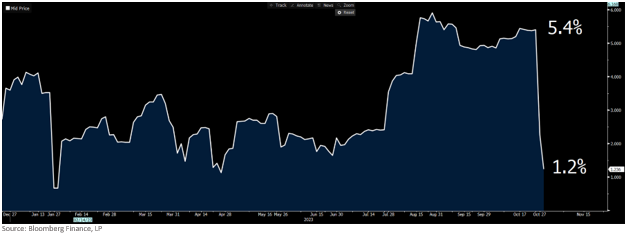
Fed Funds is currently 5.4%. Core PCE is currently 3.9%.
Fed Funds – Core PCE = Real Rates
5.4% - 3.9% = 1.5% real rates
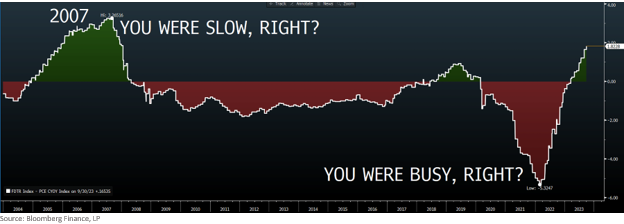
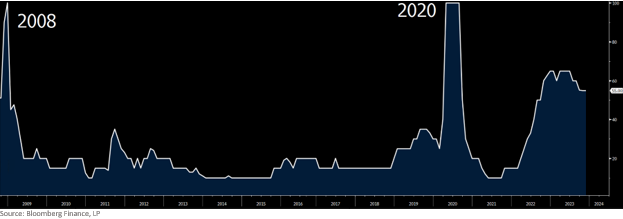
Here’s a 20 year history of Fed Funds minus Core PCE. Positive (green) leads to a slowdown (and don’t forget we were in a recession before covid hit, so that green is accurate). Negative territory (red) is when we were all busy doing deals.
We are comfortably in the green. The Fed’s actions are applying the brakes to the economy.
In this scenario, the Fed solves for the braking action. If Powell thinks 1.50% is the appropriate amount of brakes, he moves Fed Funds lower as Core PCE moves lower.
The Fed’s last SEP projected Core PCE to end 2024 at 2.6%. That is 1.3% lower than current levels, which means the Fed could cut rates by 1.3% and maintain the same level of braking action on the economy. That would put Fed Funds at 4% at year end 2024.
But the Fed will also likely look at 10 year real yields, which are at levels last seen right before the Great Financial Crisis. That ended well, I’m sure this will, too.
Likelihood of this scenario: 20%
The odds of this scenario are higher than usual because of the election. Speaking of which…
Election Pressure
Powell’s term runs through 2026. Pressure will be applied from the WH, but I’m not sure how much he cares. I do believe, however, he cares about optics, so he will start sending messages about the Fed’s independence and how it does not factor in an election into its decisions.
Given the optics, he might be inclined to move a little sooner than usual because he might otherwise feel obligated to wait until December.
Alternatively, he might set the stage for some sort of “autopilot” description of rate cuts. “We expect to cut rates 25bps every other meeting.” He would need to do this early enough in the year to have the desired effect on optics for the election.
Hey, Your Totals Above Didn’t Equal 100%
For those that didn’t bother to check that my percentages totaled 100%, don’t worry, I wouldn’t have, either.
The last two years have been pretty humbling for those of us in the rate markets, so I need to allow 10% chance of inflation reaccelerating. If that happens, hikes remain on the table (but continue to believe time is more important than peak).
Powell has expressed a lot of love for supercore inflation (core inflation less housing). Why does this matter? Because the last three months have shown reacceleration.
September 0.61%
August 0.37%
July 0.19%
June 0.00%
Using the same methodology I use to annualize other inflation measures, supercore is annualizing at 4.68%. No bueno.
I put this scenario at 10% because I like being overconfident, but also because the economy is clearly slowing and that will drag prices down with it. Speaking of economic slowdown…
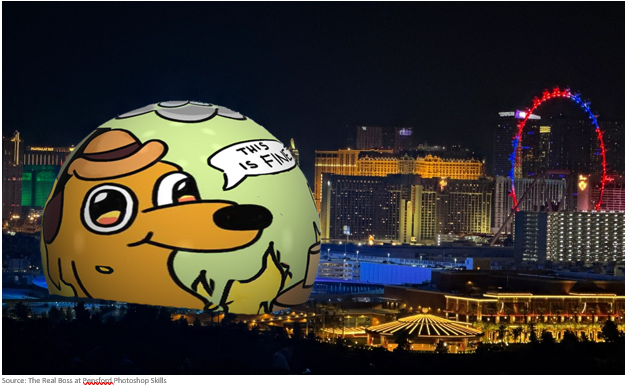
This is Fine
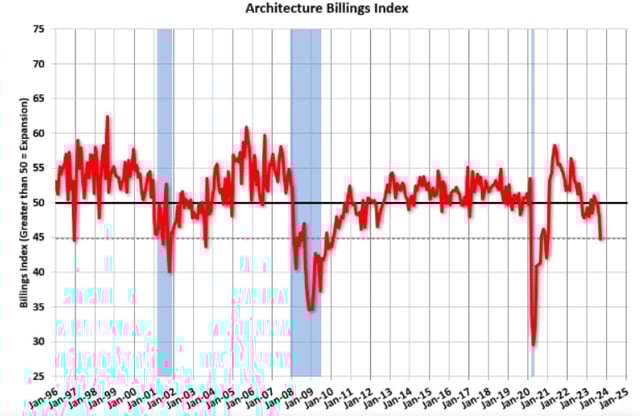
The AIA/Deltek Architecture Billings Index (ABI) is a survey of architectural firms that provides a 9-12 month forward look into billing. It has fallen to levels that signal recession. “The AIA/Deltek Architecture Billings Index (ABI) score of 44.8 for the month is the lowest score reported since December 2020 during the height of the pandemic and indicates that the share of firms reporting declining billings has significantly increased.”
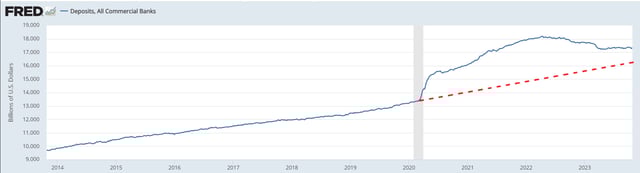
Consumer excess savings from the pandemic helicopter money is nearly gone. Credit card debt is north of $1T, likely reflecting an overconfidence in job security. Student loan repayments have started back.
The Atlanta Fed GDPNow Forecast for Q4 plunged to just 1.2%.
The Recession Probability Index is keeping some pretty sketchy company.
To prove how much I believe everything is fine, I forked over $450k to advertise my favorite meme on the Vegas Sphere.
10 Year Treasury
Rapid movements also happen on the way down. Following the Fed meeting, we said 4.75% was a key level and if we broke it, 4.50% was the next stop. Well, here we are.
After 4.50%, the next stop is 4.35%. My guess is that the dozen or so Fed speeches will likely put upward pressure on the 10T this week with 4.75% as the ceiling.
Week Ahead
At least 14 Fed speeches this week! Don’t be surprised to hear them all talking up the potential for more hikes. When the 10T drops, it’s counterproductive for the Fed’s goals of slowing the economy. So, they will keep talking up hikes just to avoid having to hike.
RIP
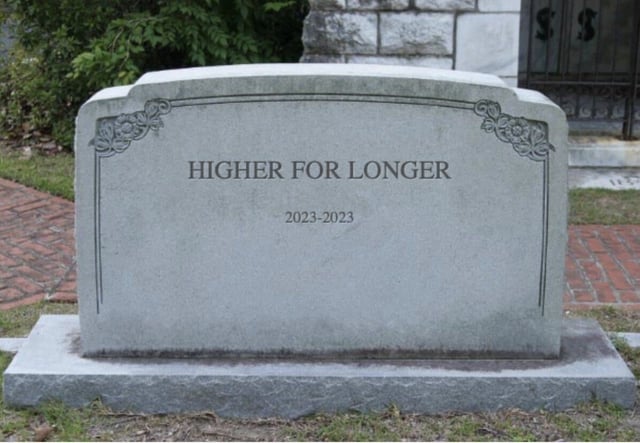
Source: Austin E. St Pete FL