

Last Week This Morning
- 10 Year Treasury spiked to 1.60% (again) before retracing and closing out at 1.56%
- German bund up to -0.27%
- 2 Year Treasury unchanged at 0.13%
- LIBOR is at an all-time low of just 0.10%
- SOFR is testing its all-time low of 0.01% from March of last year
- The economy added 379k jobs last month vs an expected 200k
- Leisure and hospitality accounted for 94% of the gains (355k of 379k)
- December and January were revised a combined 38k higher
- The unemployment rate dropped slightly to 6.2%
- ISM Manufacturing came in above expectations at 60.8% vs. the projected 58.9%, showing domestic production climbed up with the index to a 3-year high
Jobs
The most important thing to know about the incredibly strong job report is this – how crazy strong will next month be? February was held back by the crappy weather I’ve been complaining about (and Texans have legitimately been struggling with). Construction jobs have been averaging a gain of 34k per month, yet February revealed a loss of 61k because of weather. Adjust for that, add another month of vaccines, and we could easily add more than 600k jobs next month. Excluding the crazy rebound last summer, March could experience the strongest job gain on record.
The second most important thing to know about the incredibly strong job report is this – tapering. The market is already pricing in a recovery, a vaccine, hiring, etc. That’s not why the 10T is surging. It’s surging because the market is pulling forward expectations for tapering.
Now, the not so good news. Firstly, average hourly earnings came in at just 0.2% (as forecasted). This will likely struggle as more low paying jobs recover.
Secondly, if the participation rate matched pre-COVID levels, the unemployment rate would be 9.1%.
We are still down 9.5mm jobs. The most jobs gained in a single month post-financial crisis was 540k. It seems likely we will do better this time around, but what’s a realistic long-term average? If 200k was a good average after 2010, is 300k a reasonable expectation now? 400k? Even if we add 500k jobs per month, it would take 19 months to recover the jobs we’ve lost since COVID.
We are off to a great start to the year, but we still have a long way to go.
10 Year Treasury
Powell said on Thursday, “We’d want to see inflation sustainably above 2% and we’d want to be on track for inflation to run sustainably above 2%. There’s just a lot of ground to cover before we get to that.”
In other words, the Fed will allow the economy to run hot. That means inflation. And that’s bad for bonds.
Powell admitted the recent spike in 10T yields were “notable and caught my eye,” but he seems more focused on “disorderly conditions” rather than the absolute level of yields. So the Fed doesn’t seem too concerned with rising yields, as long as it’s not disjointed.
One of my favorite rate strategy teams is the Bloomberg Intelligence group. They revised their year-end forecast for the 10 Year Treasury up to 1.82%.
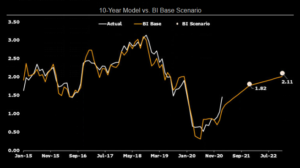
The current top end of the range is about 1.62%, which is why we keep experiencing a pull back as we near that level. If we break through, the next stop is 1.90%-ish. Like I said last week, markets are on edge. Nothing can be ruled out in the near-term.
Longer-term, I don’t buy that this is a runaway freight train. I understand why I am in the minority of this opinion. Stimulus, vaccines, deficits, inflation, etc. I get it.
But it’s not like $1.9T is being dropped from a helicopter. Of that stimulus amount, $422B is direct payments. Is $422B going to put some upward pressure on spending? Sure. But is that enough to fundamentally alter the trajectory of inflation over the next two to three years?
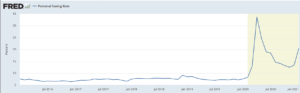
Plus, not all of the helicopter money gets spent. The saving rate spikes during recessions and coincides with stimulus payments. Here’s a graph of the saving rate over the last five years. Drop money from a helicopter during a downturn, and it turns out people hang onto a good chunk of it.
There are all types of moral hazards around providing enhanced unemployment benefits in perpetuity (don’t get me started), but I’m not sure the 10mm Americans still out of work are going to spark hyperinflation with an extra $300/week.
Instead, I think this stimulus causes a temporary surge in demand/prices/etc through this year, but then we slowly return to more fundamental dynamics.
And…if inflation fails to match expectations, don’t be surprised to see 10yr rates reverse course.
Based on the feedback I have been getting, this is an extremely unpopular opinion. If I thought I upset people with my take on COVID, I was surprised to learn how strongly people feel about inflation.
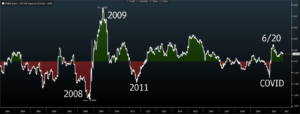
I know I’ve said this before, but it bears repeating. Inflation expectations swing more wildly than actual inflation.1 The graph below is Expectations – Actual.
- The red is when we underestimate inflation, generally heading into a downturn. “The sky is falling!”
- The green is when we overestimate inflation, generally coming out of a downturn. “Inflation is everywhere! My bar tab was $0.30 more! It’s going to be different this time around – I can feel it!”
- And then inflation does its boring old thing…prices generally increase between 0.50% and 2.0%.
I think there’s a very good chance we are repeating the same old pattern coming out of a downturn – overestimating inflation.
A correction in inflation expectations could lead to a correction in Treasury yields.
But there’s also another reason.
Money Supply
LIBOR is at an all-time low. SOFR is within 1bp of its all-time low. Cash products are at or testing all-time lows. Why?
Money supply.
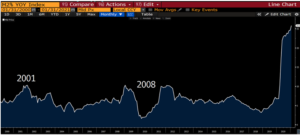
This is Exhibit A for a lot of inflation hawks. That money has to get injected into the system, right? We all think about where that money goes, but we think as consumers. How would we spend that money? And if I’m being honest with myself, I suspect that others will spend that money more carelessly than I would. “Here’s what I would do, but other people will probably just waste it on TV’s and video games.” What a waste.
But in reality, a lot of that money gets put into the bank (see aforementioned savings rate). The banks, in turn, don’t buy TV’s. They invest. Short-term deposit, so short-term investment. Cash. Overnight rates move toward zero as money flows in.
As those approach 0%, we start seeing yield grab. “OK, well SOFR at 2bps isn’t worth it, maybe I should buy a 2 year Treasury at 13bps.” Guess what happens to 2T’s? They move lower, possibly toward 0%.
Then they move out the curve. 3T. 5T. And ultimately, the 10 Year Treasury.
It might be a wild ride in between, with the 10T running up to 1.90%-ish. But over the long-term, there are far more complex dynamics at play. There’s still more than $13T in negative yielding global debt – a 1.50% 10T looks pretty darn good by comparison.
At some point, I believe inflation expectations will cool and the success story of the US recovery will be confronted with the slower global recovery. And this will keep a lid on yields, if not push them lower.
And if I’m wrong, I am sure I will be flooded with “I told you so’s”. Let’s make a deal – I will concede inflation will rise temporarily this year if you agree to wait until mid-2022 before blasting me. I will even help you out by setting a calendar reminder for June 1, 2022. If I’m right, you will 100% be reminded. If you are right, I won’t bring it up and hope you forgot to set the same reminder. Deal?
Week Ahead
More inflationary data as well as consumer sentiment data, but news on stimulus and vaccines will continue to be the driving forces.
Sources