

Last Week This Morning
- 10 Year Treasury touched 0.67% before closing the week at 0.76%
- 30 Year Treasury is 1.675%, just 10bps over Fed Funds
- German bund fell just 10bps to -0.71%
- Japan 10yr actually climbed a touch to 0.135%
- 2 Year Treasury fell almost half a point to 0.50%
- LIBOR fell 66bps to 0.86% and SOFR dropped to 1.12%
Job Reports
Not that it matters, but job growth was strong again last month. The economy added 273k jobs last month against a forecasted 185k gain. January was also revised higher. Unemployment dropped back down to the all-time low of 3.50%.
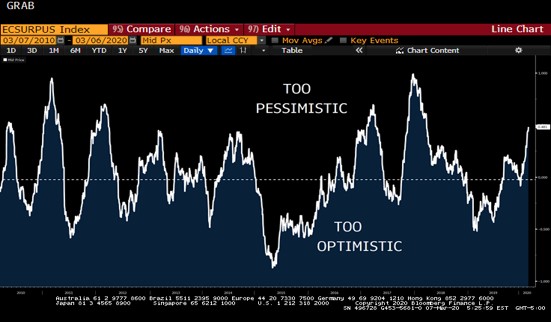
Ironically, the market was showing signs of being too pessimistic before the coronavirus hit. This is the Bloomberg Surprise Index, which measures how actual data compares to what the forecast was calling for. When it’s above the dashed line, the data is coming in stronger than expected.
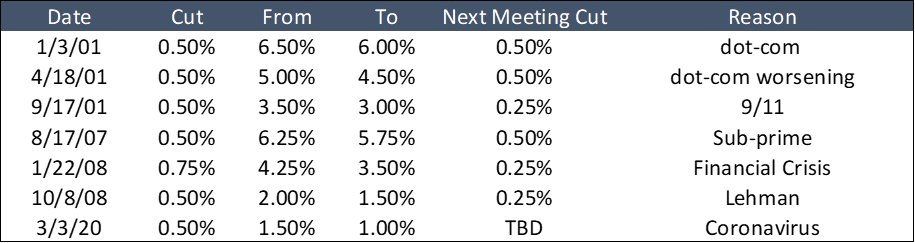
Intermeeting Cuts
There have been six intermeeting cuts over the last twenty years, so these are pretty rare events. In every single previous case, the Fed also cut again at the next meeting. That’s why the market is pricing in another 0.50% reduction at the March 18th meeting.
Once again, we find ourselves in a position where monetary policy is supposed to cure all ills. Where’s the fiscal response? Every time the Fed jumps in, it gives policy makers an excuse not to act.
I think the cut last week was mostly about sending a signal to the market that the Fed stands ready to intervene aggressively and to prevent financial conditions from tightening futher. The Fed was probably concerned that if it waited too long to respond, markets could seize up entirely and 2020 would become a lost year.
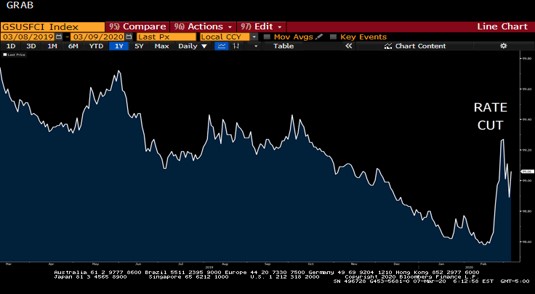
You guys know how much I like the Financial Conditions graph. Look how quickly financial conditions tightened with the outbreak, and then how quickly they eased with the intermeeting rate cut.
My issue is the Fed could have just talked about cutting rates and achieved much of the same result without an actual cut. Is cutting 50bps last week instead of March 18th really what will prevent markets from collapsing? Because it didn’t really seem to soothe stock markets. And now the Fed is basically committed to another cut next week because it has never had an intermeeting cut and then not cut at the following meeting.
We have a very clear pattern. The market bullies the Fed, and the Fed caves. And now the Fed is handing over its lunch money every time the bully demands it. I’m not sure I really want a staring contest between the two, but I’m also not sure how we break the cycle otherwise.
After the first cut in 2001, it was more than three years before the Fed hiked again.
After the 2007 cut, it was almost ten years before the Fed hiked again.
We have no way of knowing when the Fed’s next hike is, but it’s probably not anytime soon. And there continues to be a very real chance the Fed cuts rates to 0% at some point this year.
10 Year Treasury
The 10T has fallen 0.81% in the last three weeks, a drop of more than 50%. To put this into perspective, in the three weeks after 9/11 the T10 fell 65bps, a drop of just 13%. It wasn’t until a year later when the war efforts were ramping up and equities collapsed that the T10 dropped by a third.
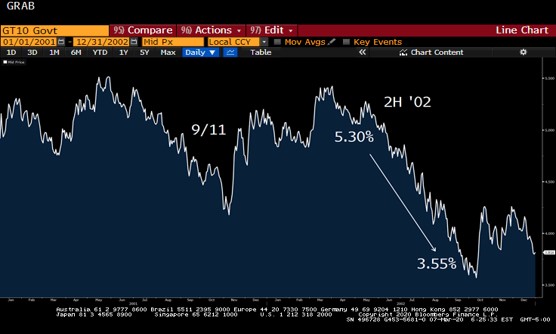
In fact, the drop in the last few weeks is far more similar to the response after the banking collapse in October 2008, when the 10 Year Treasury fell from 4.00% to 2.00% in just three weeks.
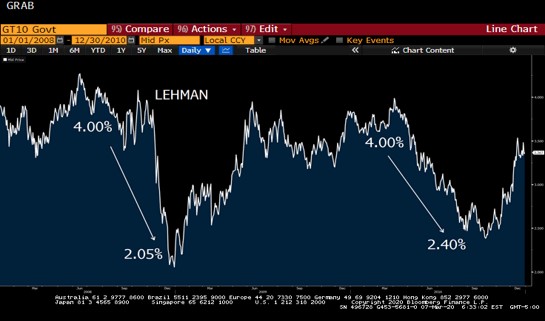
We tend to see the market react (overreact?), then a sharp rebound, and then another drop as the impact of the seizure actually works its way through the economic plumbing.
The market is responding today as if this is the financial crisis all over again. But is it?
There is a difference between choosing not to buy stuff and being unable to buy stuff. My gut tells me this drop is the former, suggesting demand will become pent up. People are still able to book that trip or buy that car, but they are choosing not to right now. In 2009, most consumers didn’t have a choice.
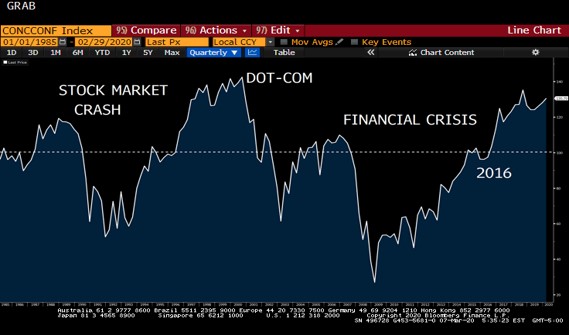
Consumer spending comprises 2/3rds of GDP. Ever since 2016 (Dems hate this graph!), Consumer Confidence has been on the rise.
After the headlines simmer down and panic subsides, how and when consumers respond over the course of this year will likely dictate whether we experience a U-shape or a V-shape rebound.
Week Ahead
Who knows at this point?