

Let’s start with a brief refresher on how caps are priced. Interest rate caps are nothing more than a compilation of options on a specific index. Each option is called a caplet, with the total cost of the cap equal to the sum of the individual caplets. If the index rate (i.e. LIBOR) exceeds the strike rate when a given caplet expires, the cap seller will pay the interest expense over the strike rate for the period to the buyer.
The value of each caplet, and thus the cap, is dependent on two factors: the market’s expected LIBOR rate at that time (based on the current forward curve) and how confident traders are with the market’s forecast (based on the volatility for each caplet).
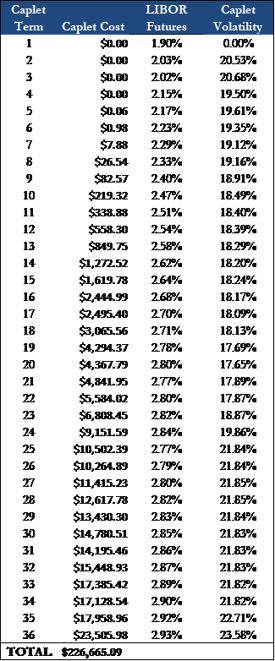
For example, the buyer of a 3yr cap on 1-month LIBOR with a strike rate of 3.50% on $100MM is essentially buying 36 options (‘caplets’). Each caplet matures on a corresponding payment date on the underlying financing and pays out if LIBOR exceeds the 3.50% for the period. The total cost of the cap is about $225k, which equates to the sum of each individual caplet.
A couple observations:
- None of the caplets are projected to be in the money, as LIBOR peaks at 2.93% in Month 36. In other words, the cap is not anticipated to provide any protection based on the current forward curve.
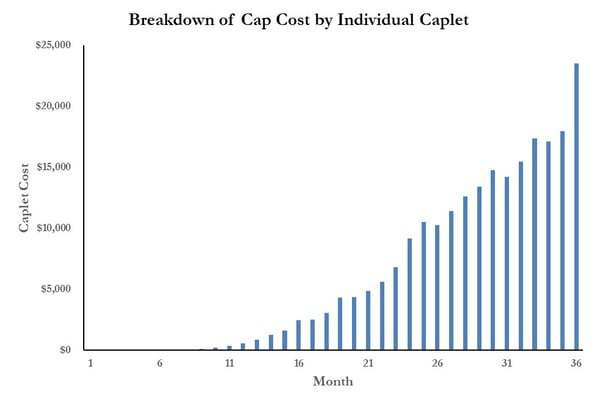
- Each successive caplet is more expensive, largely driven by the increased level of uncertainty associated with forecasting further out into the future.
- The premium traders charge for uncertainty does not increase linearly. The cost difference between a 2-year cap and a 3-year cap is much greater than the difference between a 1-year cap and a 2-year cap.
- The cost of the final six caplets, providing protection for months 31-36, represents almost 50% of the total cap cost.
- All else being equal, we would expect the cap value to drop about $20k over the next 30 days, as the most expensive caplet (expiring in month 36) burns off.
What is volatility?
Volatility is a measure of risk that indicates how much and how quickly the value of an asset changes. Said another way, volatility measures the magnitude of price changes for an asset over a given period. Higher volatility = larger range of possible outcomes.
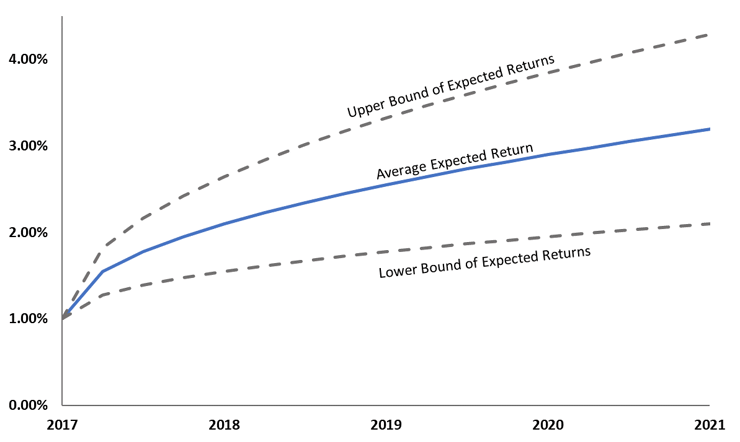
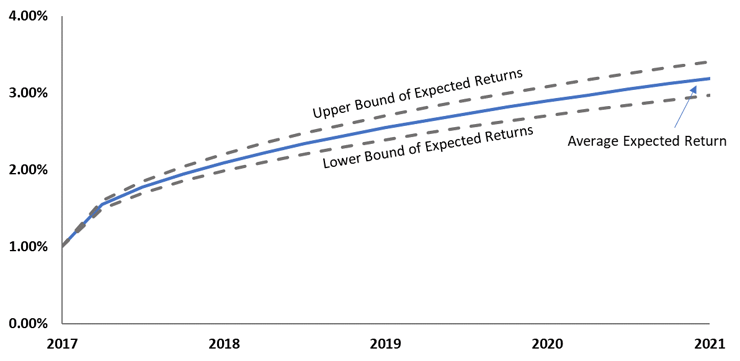
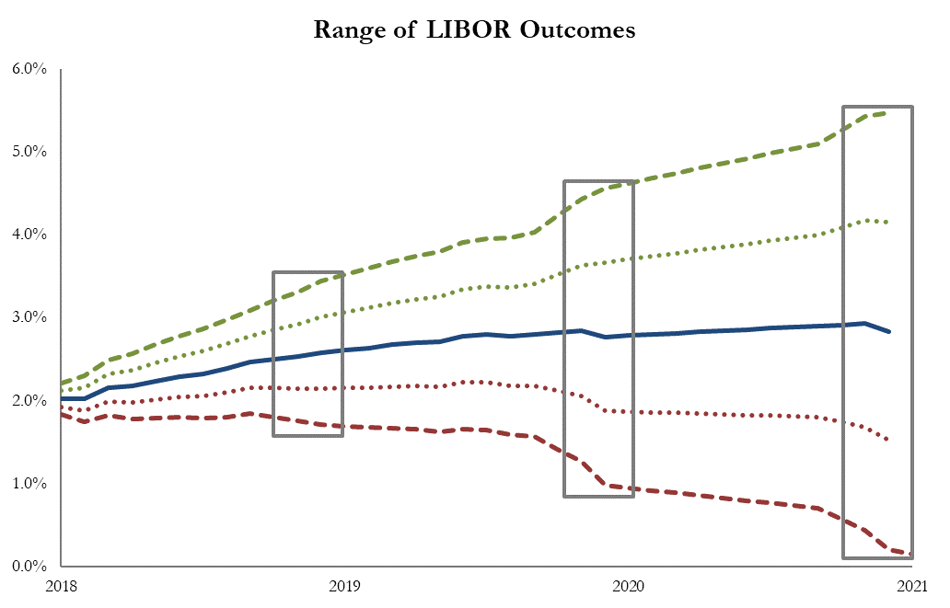
The charts above illustrate the difference in the anticipated range of returns between low volatility and high volatility assets. Note:
- Both assets have the same average expected returns, but the range of potential returns vary significantly based on the asset’s volatility.
- As we move further out in the future, the range of possible outcomes increases (i.e., the market is more confident in its forecast over the next 6 months than over the next 12 months).
Markets are forward looking, so investors and traders typically focus on an asset’s expected volatility. Instead of looking at historical volatility, market participants use the asset’s expected volatility, or implied volatility, to help quantify the investment’s risk.
Implied volatility is calculated based on option pricing for the underlying asset. Since implied volatility is a variable used to calculate an option’s price, investors can use current option prices observed in the market to back into an asset’s implied volatility.
A popular application of implied volatility is the VIX Index. Often referred to as the ‘investor fear gauge’, the index measures the near-term implied volatility of the S&P 500 (calculated based on S&P 500 index option prices). Since volatility indicates the expected range of possible outcomes, high volatility is interpreted as high market risk due to a lack a certainty (perceived certainty anyways…).
So why does this matter to cap purchasers?
Because interest rate caps are options, the value of the cap is a function of the volatility in the underlying index. The cap seller receives an upfront cash payment in exchange for taking the risk LIBOR exceeds the strike rate over the term of the contract. As interest rate volatility increases, cap sellers charge more for the options to compensate them for the added risk that rates rise much higher than the market anticipates. The relationship between a cap’s value and interest rate volatility is quantifiable thru various option-pricing models; the most well recognized being the Black-Scholes Model.
These models can also be used to determine the level of volatility investors anticipate based on current option prices.
If interest rate volatility was zero, indicating the market was 100% certain LIBOR would follow the projected forward curve, the cap cost would simply equate to the present value of the anticipated cap payments for the periods LIBOR exceeds the strike rate.
Realistically, no one is 100% confident in their ability to predict rates in the future. This uncertainty is the volatility component of the pricing, with uncertainty growing as the length of term increases.
An overly simplistic example
Take two basketball players, both average 10 points/game.
- Player A has scored between 2-18 points in each previous 10 games this season.
- Player B has scored between 9-11 points in each previous 10 games this season.
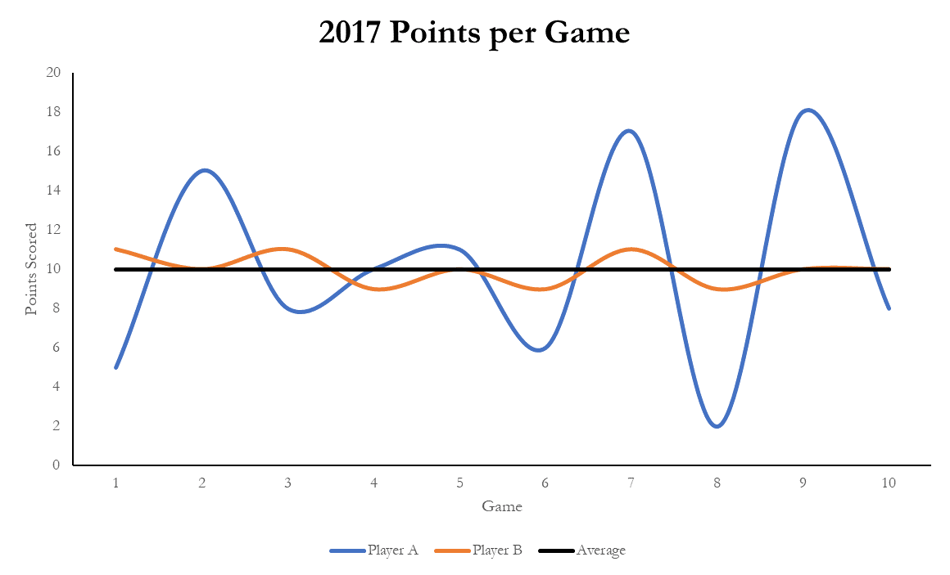
If you could buy an option that paid $1 for every point over their average that a player scores in the next game, would you pay the same amount for an option on Player A as you would on Player B because both players are ‘expected’ to score 10 points? Of course not, as Player A has the potential to have a great game and score 18 points, resulting in a gain of $8 on the option. On the other hand, Player B will likely score around 11 points if he has a good game, resulting in a gain of $1 on the option.
Given one option has the potential to be worth $8, while the other will likely not be worth more than $1, a buyer should be willing to pay more for the option with the higher potential upside.
Player A is the riskier bet, as he is clearly a ‘streaky’ player and there is a lack of certainty on how he will play on any given night. His scoring is more volatile; if he gets hot, he can put up more points. Player B is the consistent player you expect to go grind out about 10 points every game, rain or shine.
In the context of an interest rate cap, the seller of the option is the cap provider, with the cap purchaser buying the option. Using the above example, the player’s average points per game represents the expected level of LIBOR at the end of the next period. The option pays out when the index rate exceeds the strike price (the player scores more than expected).
When determining the price of the option, the cap seller will look at market expectations for LIBOR as well as how confident they are in those rate projections.
Quantifying the Effect on Pricing
Let’s look at the cost of a cap in two different volatility environments.
Notional $100,000,000
Term 3 years
Strike 3.00%
Index 1-month LIBOR
Volatility spiked in 2016 following the surprise election of Donald Trump. In December 2016, the market expected LIBOR to average 1.57% over the next three years. This is also known as the ‘at-the-money’ (ATM) rate.
Pricing on 12/15/2016
ATM Rate 1.57%
Volatility 40.15
Cap Premium $340,000
A couple months later, in February of 2017, markets had a chance to digest the Trump victory and volatility moved lower. Note, the market still expected LIBOR to average 1.57% over the following three years.
Pricing on 2/15/2017
ATM Rate 1.57%
Volatility 35.72
Cap Premium $232,000
Neither cap was expected to provide any protection and the market did not expect LIBOR to exceed about 2.25% over either 3-year term, but the cost of the cap decreased by over $100,000 due to the lower level of volatility.
