

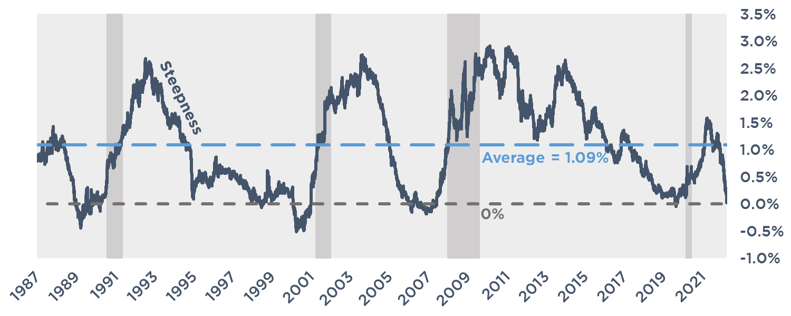
Yield Curve Steepness
A commonly accepted maxim in the interest rate market is that an inverted yield curve precedes a recession. Traditionally, the measure of the steepness of the yield curve is the difference between the 10 Year Treasury and the 2 Year Treasury.
The 2T is directly controlled by Fed monetary policy, whereas the 10T more generally reflects expectations for economic growth and inflation.
- As it becomes apparent the Fed will begin a tightening cycle, the 10T climbs as it begins pricing in rate hikes. This can happen well in advance of the first actual hike.
- The 10T then waits for the front end to catch up. During this time, the yield curve is generally steeper than at other times during the cycle.
- As time passes, the market gains greater clarity around the path of Fed Funds. If it begins to look like the Fed will hike less than expected, the 10T may fall. If it begins to look like the Fed will hike more than expected, the 10T may climb.
- The 2T begins climbing once the rates hikes become imminent. This yield attempts to price in what Fed Funds will average over the next two years.
In a healthy economy, a 10 year rate should be higher than a 2 year rate as a result of term premium. If an investor is willing to accept a lower yield for the next 10 years than what is available for the next 2 years, there must be a lot of concerns about what might happen over the next few years. If the Fed slashes rates to 0%, that 10 year yield will look very attractive.
The later we get into a tightening cycle, the more restrictive monetary policy becomes. This restricts borrowing and dampens economic growth – the real intent being to control inflation.
As the market becomes dubious about the continued growth of the economy, the 10T begins to stall and may even fall. Because markets are forward looking, this can occur while the Fed is still hiking in the midst of a healthy economy. The market is starting to price in a slowdown and a flight to quality ensues.
If the market believes the Fed will be overly aggressive with rate hikes, it may believe the Fed will hike us into a recession. Money starts flowing into long-term, safe investments. The long end of the curve falls, while the Fed is still raising the front end of the curve. This creates a flattening effect.
Yield Curve Steepness – Historical
Since 1987, the average steepness of the yield curve has been 1.09%.
Can the Fed Steepen the Yield Curve?
This Fed may struggle to hike Fed Funds to 3.00% if the 10T doesn’t climb above 3.25%. If the Fed wants to hike, and needs a certain amount of room of yield curve steepness, can the Fed steepen the yield curve?
Steepening the yield curve would require some combination of lower front end rates or higher long end rates.
Front End – Lower or Stop from Climbing
The Fed has direct and very precise control over the 2T. If the Fed wants to restrict the 2T from climbing, it can do so very quickly. In general, it would do so by signaling a slower path of rate hikes. This signal could come in a variety of forms:
- Lower the ultimate landing spot
- Reduction of hikes in the dot plot
- Assurances of no hikes after a certain point
- Stop hiking
- Simply wonder aloud about the possibility of fewer hikes
Long End – Increase
The Fed can influence the long end of the curve, but with far less precision than the front end.
- Balance sheet normalization has historically been the Fed’s preferred tool to push up the long end of the curve, and a suggestion of increasing the pace could drive up the 10T.
- Simply talking about increasing the pace of balance sheet normalization could push up the 10T.
The flatter the yield curve becomes, the more likely the Fed will need to address it publicly.
Fed Engineered Recessions
The market believes the Fed can hike the economy into a recession because…it usually does.
Here is a graph of Fed tightening cycles with grey bar recessions. Notice a correlation?
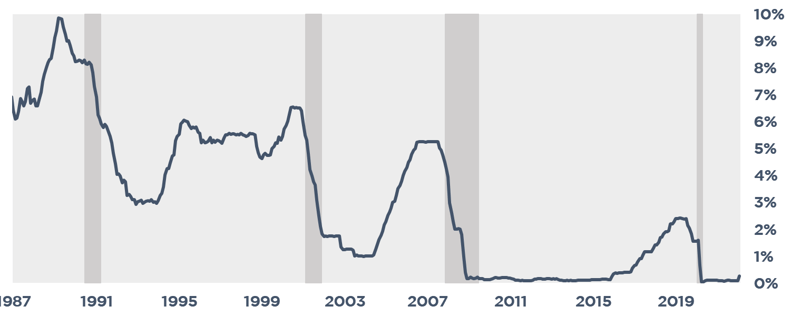
The more aggressive the market believes the Fed will hike rates, the greater the concerns that the Fed could hike us into the next recession.
Those fears can cause a flight to safety, flattening the yield curve and exacerbating the issue.
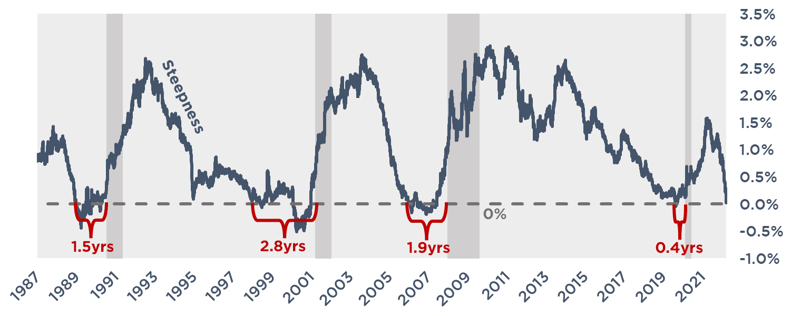
Inverted Yield Curve – Historical Analysis
So, what’s the deal with an inverted curve anyway?
There have been times when the economy has entered a recession without an inverted yield curve – in other words, the absence of an inverted curve doesn’t guarantee we will avoid a recession.
But when the yield curve has inverted, it has always been followed by a recession. We dug into some of the critical takeaways from previous inversions.
First, let’s take a look at the inversions since 1987. We used this as a cutoff given how much more significant capital markets developed after this time, but the data from previous inversions tell a similar story.
Yield Curve Steepness Since 1987
Yield Curve Inversion Metrics
Average Inversion Length – 488 days
From the time the curve first inverted, to the last day it went positive and didn’t invert again, was 488 days. That means nearly two years of an inverted yield curve. But the curve flip flops between positive and negative during this time.
Average Inversion Length (Negative Days Only) – 236 days
If we count only the days the curve is inverted during the same window as above, there have been an average of 236 days of inversion. One of the takeaways here may be that a temporary flip positive should not be interpreted as the all-clear signal.
Average Inversion – 0.16%
The average inversion was just 0.16%. The takeaway here may be that the inversion doesn’t have to be dramatic.
Average Max Inversion – 0.30%
The average max inversion was just 0.30%. In this scenario, if the 2T is 3.00%, the T10 would be at 2.70%.
Average Days Until Recession – 609 days
From the first day of inversion to the start of the recession as defined by the NBER, almost 20 months pass.
Maybe the takeaway is that an inverted yield curve should not mean we are already in a recession, nor that one is imminent.
After the yield curve inverts, we will likely hear lots of commentary why this time is different. Maybe they will note how the inversion was just for a few days and has reversed course, so it probably doesn’t mean anything. Or maybe that the curve is “only” inverted a few basis points, which is normal for reason XYZ. Stocks may keep climbing. Job growth may continue.
But unlike equities, the yield curve doesn’t lie.
If it inverts, we’re headed for a recession – it’s probably just a couple years away.
