

How do I even talk trash to a Pats fan this morning? “Sorry, I can’t hear you over the clanging my six rings are making.” I’m just glad they’re out. But let’s be honest, there is 0% chance Tom Brady isn’t in a Pats uniform in the fall. And that means I get to keep seeing him in his ridiculous trench coats and beanies. He’s about as representative of a blue-collar New Englander as Trump is representative of a Midwest farmer.
Last Week This Morning
- 10 Year Treasury fell to 1.788%
- German bund spiked to -0.18%, then fell back to -0.29%
- Japan 10yr unch -0.02%
- 2 Year Treasury dropped to 1.525%
- LIBOR has settled back down to 1.71% after the typical year-end bump
- SOFR at 1.54%
- Manufacturing had its worst month since 2009
- An American drone strike took out Iranian General Qassem Soleimani, increasing the odds of a war with Iran (we’ve been in Afghanistan for nearly 20 years now)
- Ohio State and Michigan lost
- As the newly appointed College Football Czar, I hereby declare Wisconsin ineligible from all meaningful college bowl games until further notice
- How about them Cowboys! Cheer up pokey fans, you still have the Lakers and Yankees to root for…
- I wrote this before the Eagles played, freeing me to talk smack without the shame of a potential L hanging over my head
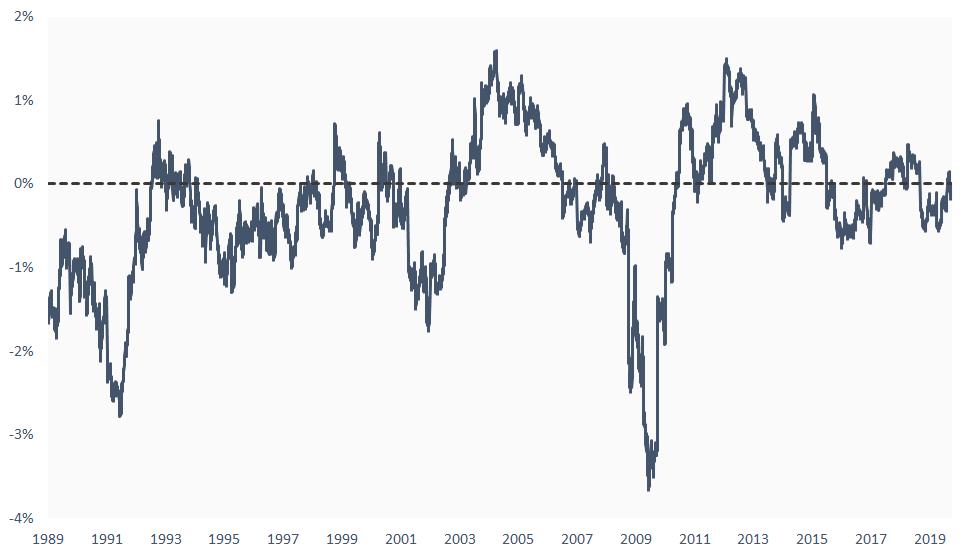
Manufacturing
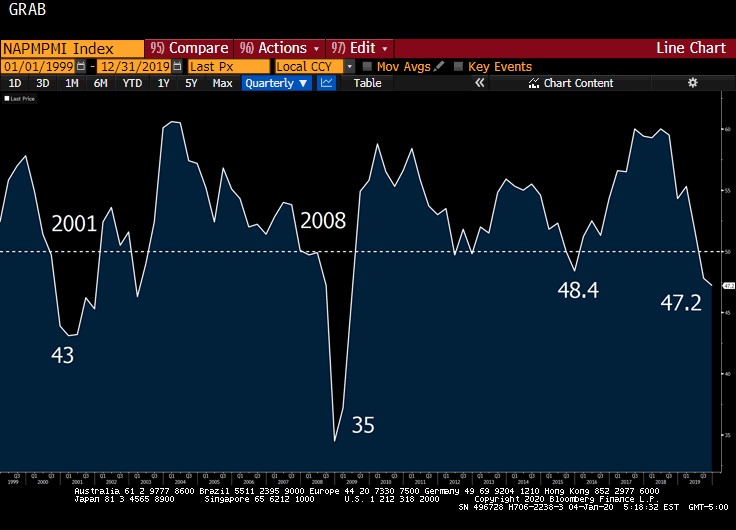
I know less about manufacturing than I do about rates, and that’s a pretty low bar. But I do know that manufacturing is generally representative of the economy as a whole. While manufacturing as a percentage of GDP has declined with the US moving toward a service-based economy, it’s still about 12% of GDP. That’s significant enough to make the recent contraction a big deal.
Check out manufacturing over the last 20 years and how it closely it corresponds with recessions in 2001 and 2008. It’s below levels from late 2015 and early 2016 when we had a near recession.
Floating Rates – Fed Funds/LIBOR/SOFR
Let’s get one thing clear – the Fed is not hiking this year. They may cut, but they will not be hiking.
And in 2021 and beyond, the single biggest determinant for rate hikes will be inflation. That’s it. Powell made it clear that rate hikes will require inflationary pressures, which have lagged over the last decade. Maybe Powell gets replaced at some point and changes the dynamic of this discussion, but let’s assume he’s still at the helm for the next few years.
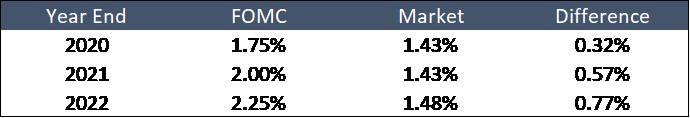
The Fed expects to begin hiking in 2021 and 2022, albeit at a very gradual pace. The market disagrees and expects a cut this year, followed by no changes for the next two years.
Floating rate borrowers have little to no risk of rising rates this year. After that, inflation will dictate whether the Fed can hike.
And everything else will dictate whether they cut rates.
What does this mean for floating rate borrowers?
- Flat or falling interest expense for the foreseeable future, with very little likelihood of a surprise jump in floating rates
- Cap costs should be relatively low depending on volatility
- Keep negotiating those floors!
Speaking of floors, please don’t hesitate to contact us to value a floor to assist with your negotiations. Let’s say you have a $25mm term sheet with a 3 year floor at today’s LIBOR of 1.71%. You’re focused on proceeds, loan spread, closing costs, etc and the floor feels like a throwaway.
The market puts the value of that floor at $325,000. That’s the equivalent of 0.43% in the loan spread. I would bet the farm you would care about 0.43% in the loan spread, so why do we ignore the hidden cost of a floor?
Even if the lender is unwilling to budge, quantifying the cost of the floor can help negotiate other aspects of the financing.
10 Year Treasury
The Fed has near total control over LIBOR and is committed to transparency, so it is much easier to forecast than long term fixed rates. But lack of certainty has never stopped me from commenting on rates before, so why stop now?
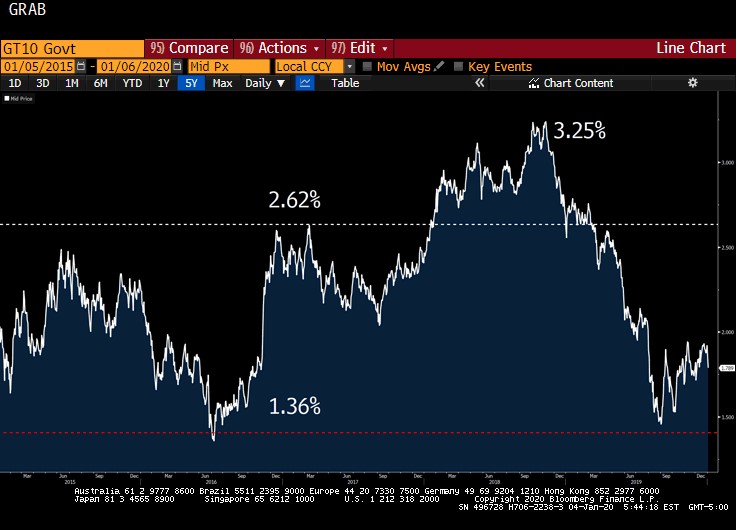
First, it’s very likely the 10 Year Treasury will remain within a band between 1.36% and 2.62%. I know that’s not very helpful, but anything below or above those levels will require a significant catalyst. If a 3.00% 10 Year Treasury has you losing sleep, just know that it will take a perfect storm of events to get there.
We sometimes get too caught up on intraday movements, which are frequently driven by a positive/negative economic data point or a (not-so) presidential tweet. Those may cause rates to jump or fall by 0.10%, but alone don’t establish new trends.
I tried to hammer this home in the year ending newsletter and I will do so here again because it is so critical. Here are the three long term primary drivers of the 10 Year Treasury.
- GDP
- Inflation
- Global Yields
If you tell me where these are headed, I can (probably) tell you where the 10T is headed.
Bond hedge fund billionaire Jeffrey Gundlach has this crazy simple back of the envelope calculation to estimate the appropriate level for the 10 Year Treasury yield.
(GDP + Inflation) + German Bund = 10 Year Treasury Yield
2
That’s so simple even a state school kid like me can follow it. It hits on the primary drivers I just highlighted.
Here’s a graph since 1989 comparing the 10 Year Treasury yield (blue) against Gundlach’s estimate (grey). I guess there’s a reason he’s a billionaire and I’m not.
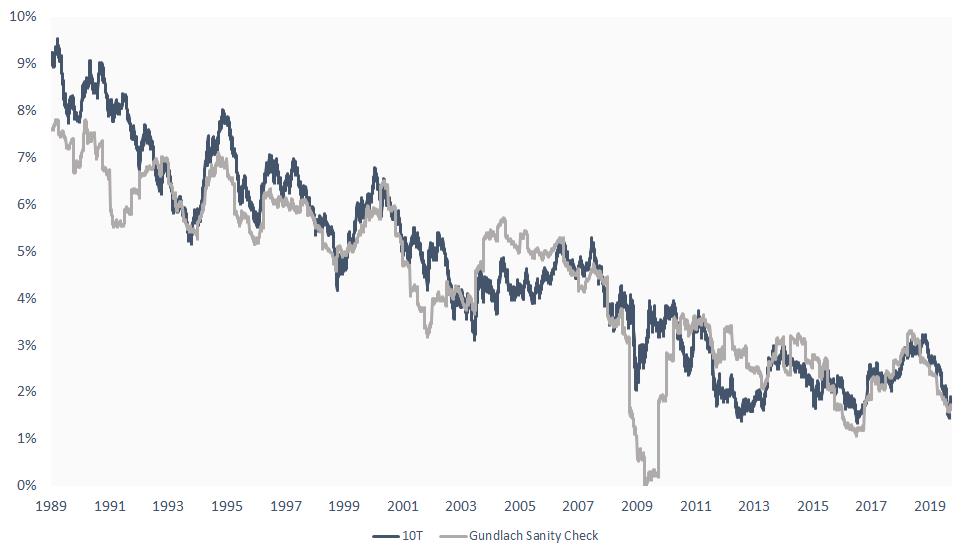
Solving for the difference between Gundlach’s rule of thumb and the actual 10T. When there is a large deviation, it usually means something has to give. But since they are on top of each other right now, it suggests the 10T is about where it should be. Again, just big picture.
Insert beating-a-dead-horse emoji here about what drives the 10T yield:
- GDP
- Inflation
- Global yields
If you want to know where the 10 Year Treasury will go this year, focus on those components. Let’s take a very quick (promise) look at each.
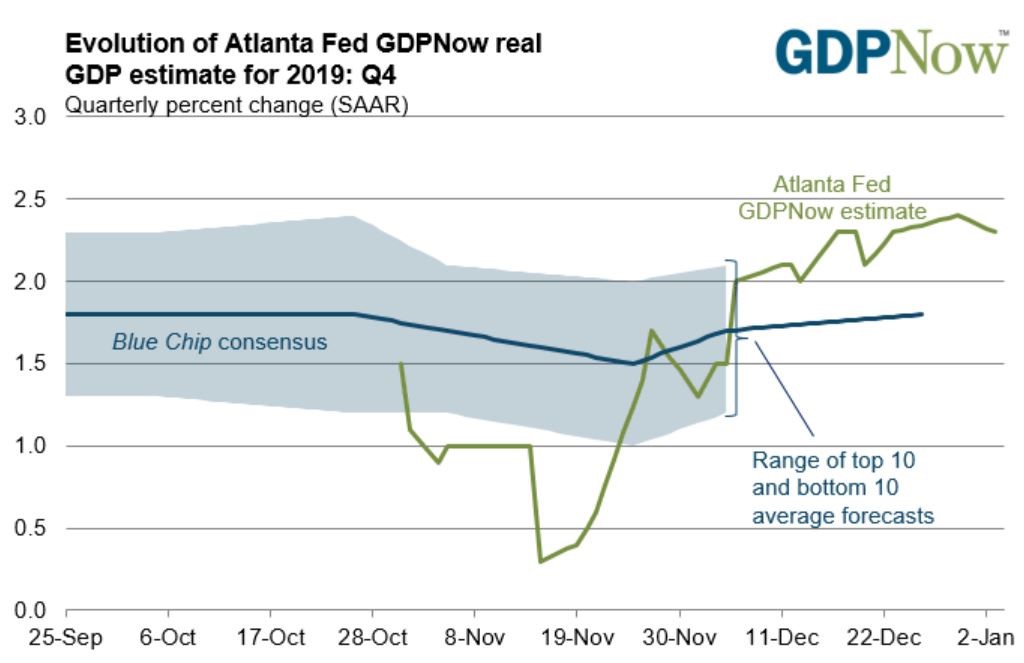
GDP
If GDP moves up, or even if just expectations arise that GDP will move up, that gives the 10T room to move higher. Conversely, the same is true if GDP (or GDP expectations) decline.
Q3 GDP was 2.1%. The Atlanta Fed’s GDPNow forecast for Q4 is 2.3%, while the consensus forecast is for 1.8%. In other words, not much deviation.
There isn’t a lot of expectations for dramatically higher GDP this year, so at a minimum GDP will likely keep a lid on rates for the foreseeable future. A surprise one way or the other could drive yields to move, however.
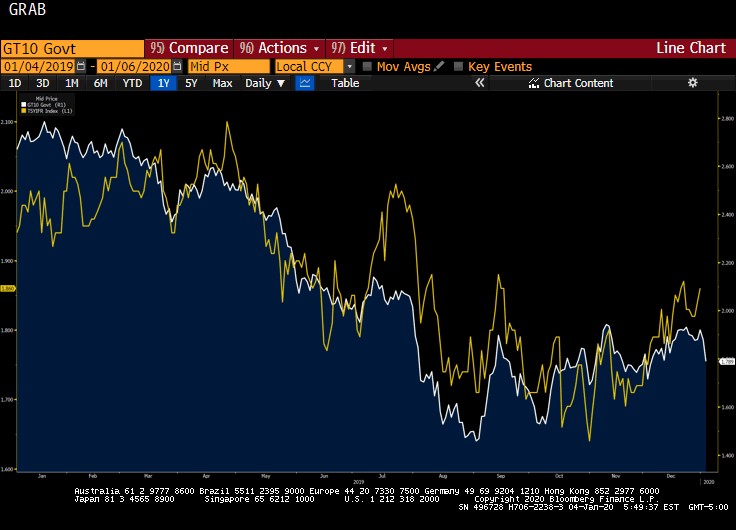
Inflation (and Inflation Expectations)
Inflation is frequently overlooked when it comes to what drives the 10T. If you take away nothing else, please know that inflation is a huge technical driver of fixed rates. But it isn’t just where inflation is today, it’s where are inflation expectations.
Here’s a 2019 graph comparing the 10T (blue) against future inflation expectations (yellow). Notice how closely the move together.
If inflation expectations move one way or the other, the T10 will follow.
Global Yields
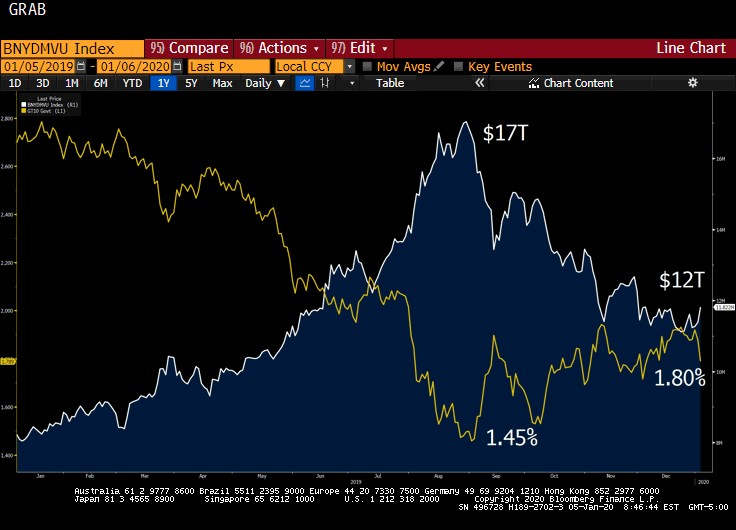
We spent a lot of time last year talking about how global negative yielding sovereign debt reached an astounding $17T in the summer, but we spent less time talking about how that reversed course over the second half of the year. There is now about $12T in global negative yielding sovereign debt.
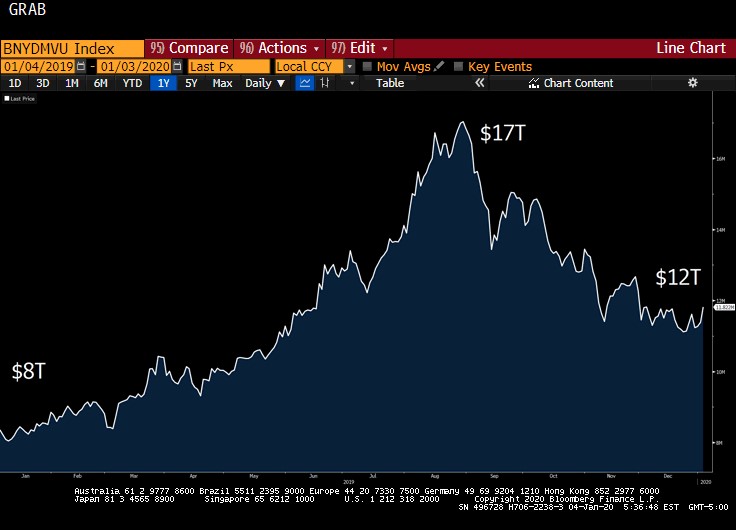
Here’s the same graph with the 10 Year Treasury overlaid. Notice an inverse correlation?
Wild Card – Central Bank Policy
This is actually captured in all three components, right? Central bank monetary policy effects GDP, inflation, and yields. After unwinding about $900B, the Fed needed to enact emergency repo facilities (but absolutely positively not QE) beginning mid-September.
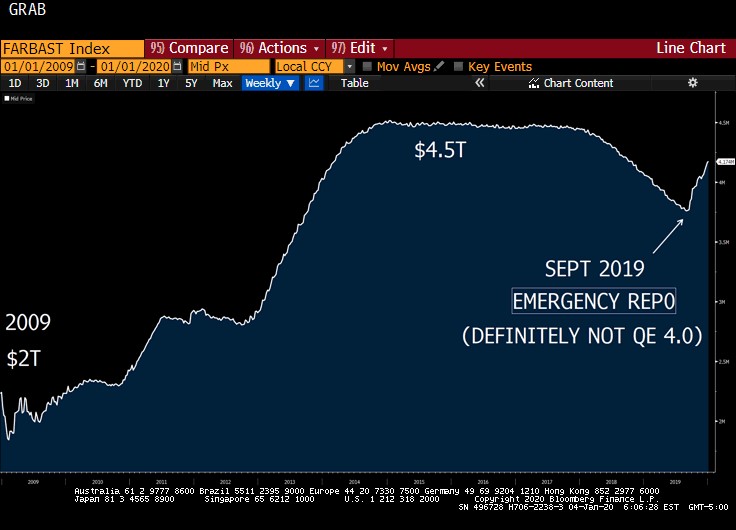
On the one hand, it’s reassuring that the Fed responded quickly to rapidly deteriorating market conditions.
But on the other hand, it’s worrisome that the Fed was unable to unwind its emergency monetary policy measures without the market puking.
We have reasonably strong GDP, record high stocks, record low unemployment, and the Fed had to ramp up QE to avoid a market seizure. Not a great sign.
If central banks send accommodative signals in 2020, it can create a risk-on mentality and allow rates to climb. But it is a fine line to walk. Are you sending accommodative signals because things are bad? Or are you simply saying you won’t be the reason we have our next recession?
This Week
Not a ton of significant economic data until Friday’s job report. Several Fed speakers are lined up on Thursday.
Also, the Phase 1 trade deal is supposed to be signed January 15th. Any developments on that front can swing rates one way or the other.