

You write one April Fools newsletter and send rates to the moon…
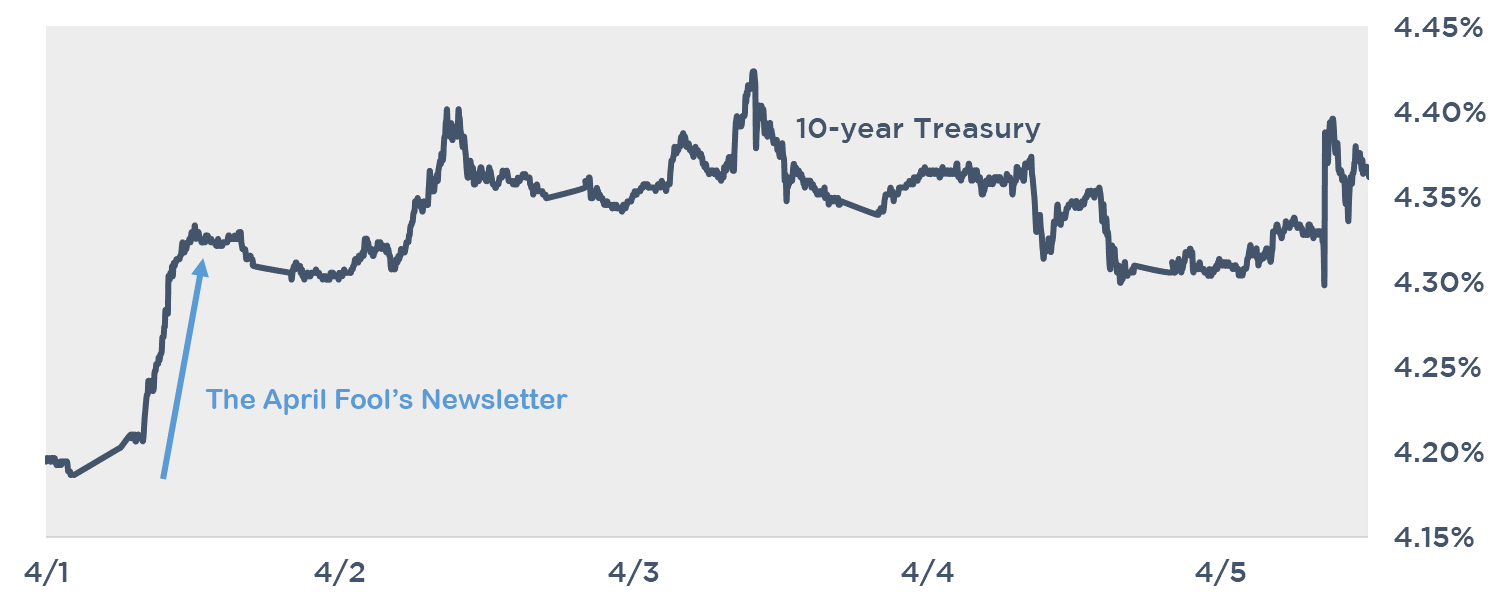
It was a joke! The first letter of each paragraph was bolded and spelled out April Fools! Can the 10T please go back towards 4% now? With great power comes great responsibility… Some of our kids were always straight A students. They didn’t need our help or prompting. They take after the real boss here at Pensford, Sarah. Some of our kids take after me. They hate school. It doesn’t come naturally. It’s boring. Sitting still for 7 hours a day is a near impossibility. Something strange happened when school went remote for covid. All of our kids were suddenly straight A students. The struggling students were doing just as well as the ones that loved school. It was weird. Were they suddenly better students? Or did something else change? Metaphor alert…
Last Week This Morning
- 10 Year Treasury at 4.39%
- German bund at 2.41%
- 2 Year Treasury at 4.74%
- SOFR at 5.32%
- Term SOFR at 5.32%
- Nonfarm Payrolls Report printed at 303K vs 214K expected
- Unemployment Rate printed at 3.8% as expected
- Fed Powell Speech
- "Given the strength of the economy and progress on inflation so far, we have time to let the incoming data guide our decisions on policy, meeting by meeting”
- Inflation has become bumpy on its way to the targeted 2%
- Fed Speeches
- Bostic – Sees it appropriate to start moving down at the end of this year, in the fourth quarter
- Kugler - Still sees lowering of policy rate appropriate this year, give no indication of time
- Barkin – Inflation data “has been a little less encouraging”, believes the Fed should take their time making decisions about cutting
Labor Market Strength? Or Just Different?
Total hypothetical…but what if our kids weren’t magically smarter after March 2020? What if, and I’m spit balling here, our kids just had access to the internet while they took the tests with no teacher staring at them to prevent cheating? What if teachers decided that simply getting through a pandemic was good enough? What if some parents (not us obviously) decided that sounded pretty good to them, too?
In that totally hypothetical scenario, should I be bragging about my kids’ newfound 4.0 GPA? Should our kids’ college professors feel obligated to keep doing the same thing to ensure everyone keeps getting A’s? Are their grades a reflection of their efforts or the unusual measures schools took?
This is how I feel about the current labor market. The government threw $5.5T of stimulus money, $4.5T of QE, ZIRP, unlimited bank lending program, and all sorts of additional support (eviction moratoriums) at the economy. We all focus on how good things feel today without much discussion of what they might feel like tomorrow when the check comes due.
Constant headlines about how strong the labor market (and the broader economy) have two major shortcomings:
- All the data is backward looking. Just because the economy hasn’t broken yet doesn’t mean it won’t break. If you say the economy hasn’t slowed, you don’t believe in math. GDP cut in half, job gains cut in half, etc. Stop saying the economy hasn’t slowed and I will concede it hasn’t broken.
- Throwing $10T+ at anything makes it better (except maybe the Carolina Panthers). What happens when that $10T runs out? Are we signing up to do this indefinitely?
Does a burst of A’s for a couple of years suggest our kids will be more successful in 10 years? Or will that check come due at some point when that unusual level of support ends?
Is that support, and the resulting strength, the new normal? Or should we look past the straight A’s to a potential time in the future when things aren’t quite the same?
Before we tackle some of the things that have changed and whether they might represent the new normal, let’s first address why this labor market feels so different (note: not stronger) than ever before.
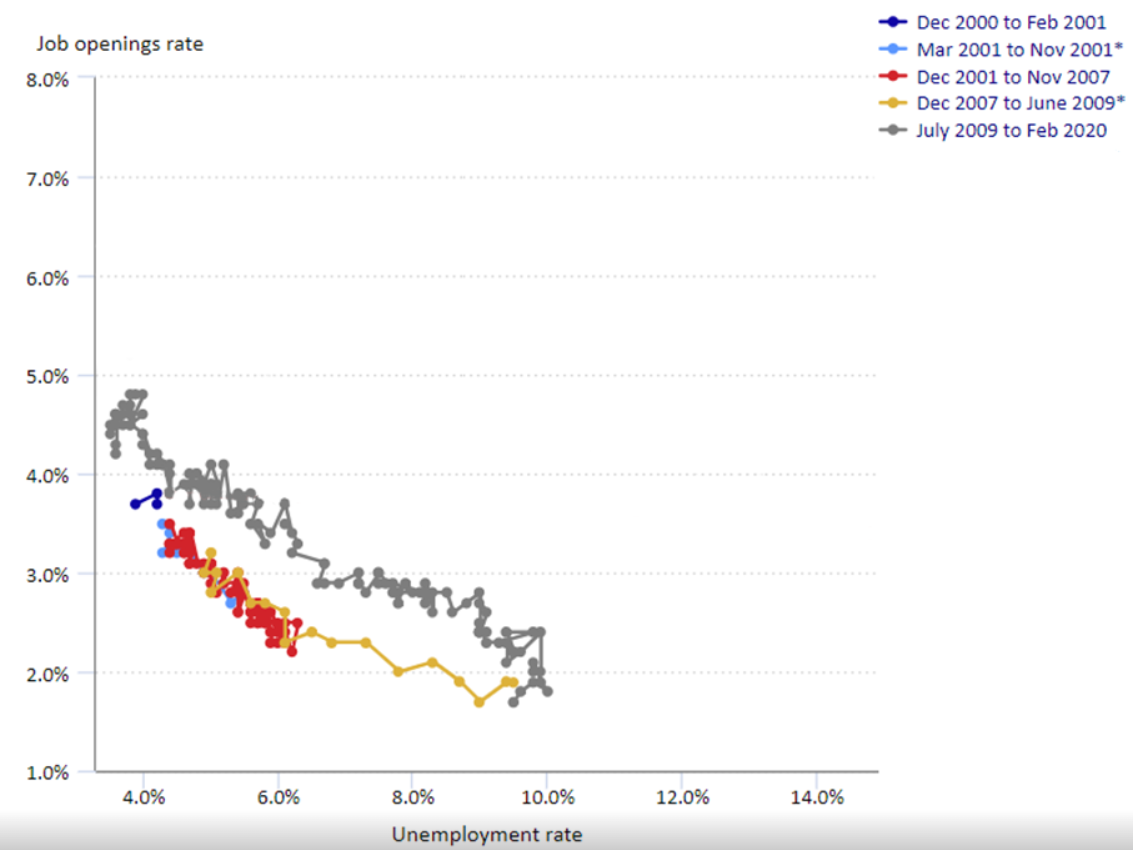
Beveridge Curve
The Phillips Curve has been debunked, but it clings to life because it is such an easy concept to grasp. Instead, you should be using the Beveridge Curve. I almost include this every week, only to toss it out because it takes a lot to explain it. It lacks the simple clarity the Phillips Curve provides.
Here’s the traditional Beveridge Curve. Job Openings Rate on the y-axis, and the unemployment rate on the x-axis. Job openings decline as unemployment increases (pushes to the right). If the UR is 10%, the number of job openings is pretty low. Lots of unemployed Americans chasing too few jobs. Down and to the right is bad.
Now let’s add March 2020 through today. Since the month of the first hike, job openings have dropped but the unemployment rate hasn’t increased at all. This is literally unprecedented.
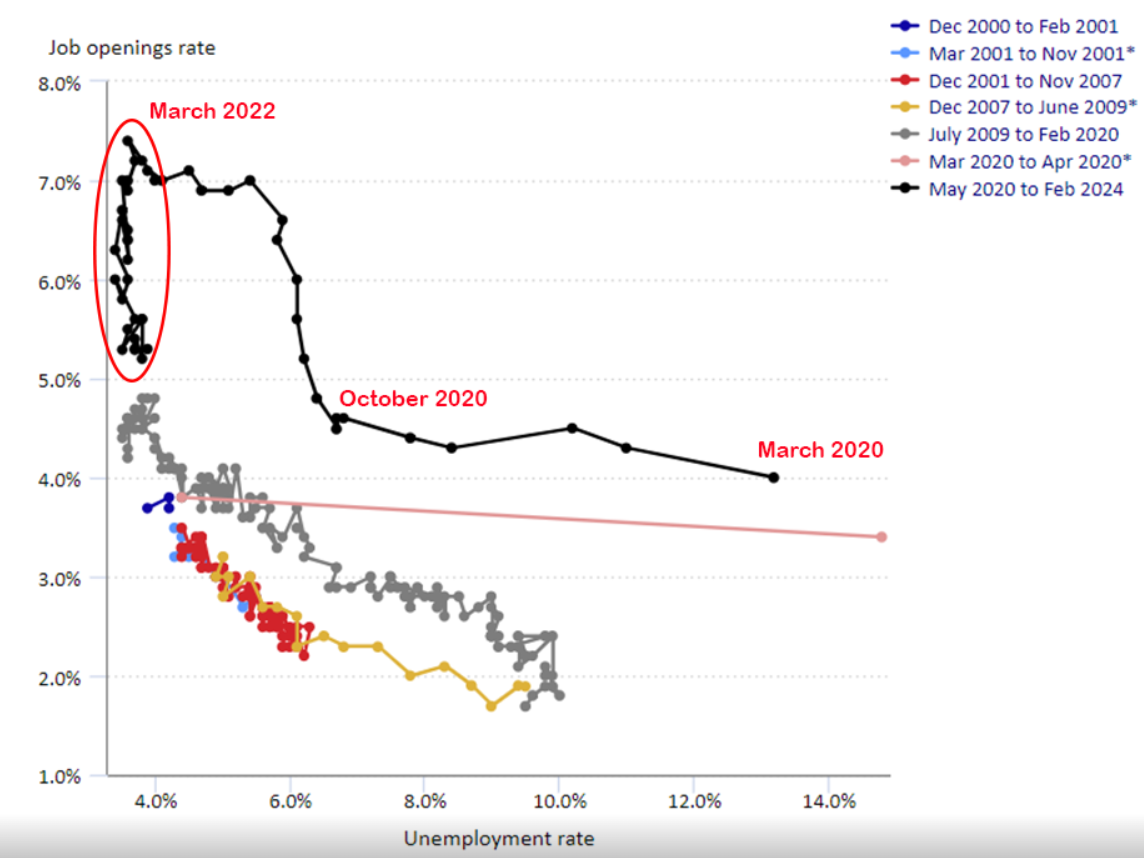
This vertical drop is why the labor market feels different than any before. Keep in mind that the Beveridge Curve was named after British economist William Henry Beveridge in a research piece he published in 1942. I’m not sure he envisioned a world where job postings could be seen by the entire world free of charge…and could be removed just as quickly.
Immigration
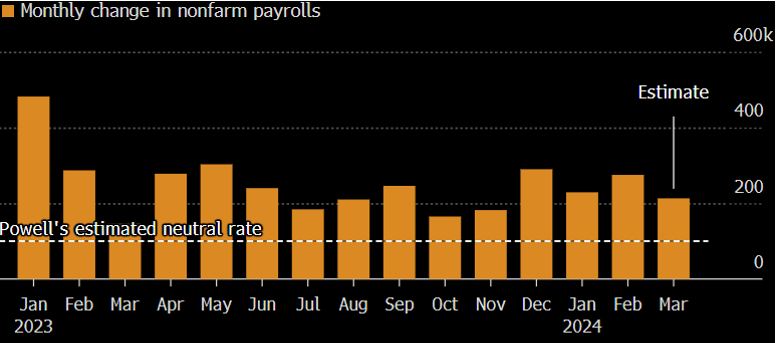
In 2022, Powell estimated the monthly breakeven NFP rate to be about 100k. This is in line with most economists, too. Think of this as the Mendoza line for jobs added each month to keep pace with population growth. In other words, fewer than 100k (rather than 0) is a signal of labor market weakness.
As long as we only focus on the headline job gains, we have beaten that breakeven point every month. Immigration appears to be playing a key role in that.
Setting aside politics for a moment, this is a good sign. The CBO estimates that “the rise in migrants will boost the economy by $7 trillion over the next decade.” We all win.
Of course, it’s impossible to set politics aside this year. In fact, the WSJ just ran an article entitled, “Why Immigration is Now the #1 Issue for Voters.”
I have no clue if immigration will continue to aid the labor market, but a presidential election with this as the number 1 issue feels like a potential risk to the strength of the jobs market. Even if it’s the new normal, we have a pretty big event risk in seven months…like my kids going back into the classroom with a teacher standing over their shoulder for an exam.
Fewer Participants
I’ve been harping on this for a while. Using February 2020’s participation rate, the Unemployment Rate today is north of 5%. That was full employment when I was in school – the labor market is doing well. Just not as gangbusters as the 3.8% unemployment rate would suggest.
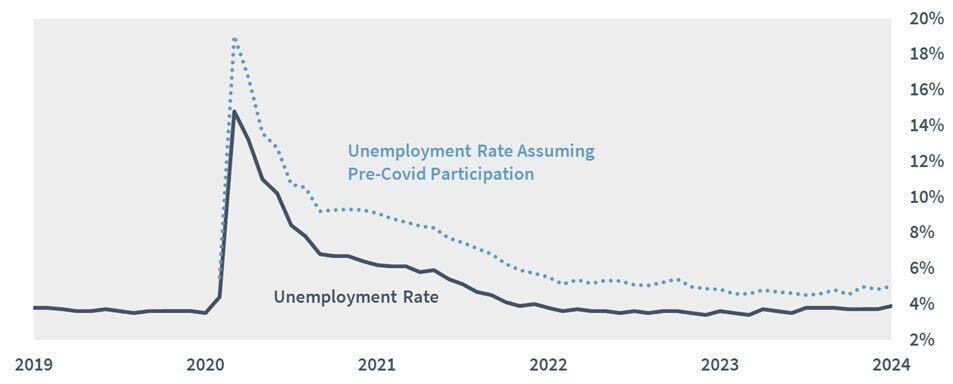
Covid impacted this a lot. Many people close to retirement age decided it was time. Younger people changing their priorities. Helicopter money, home equity, and stocks have provided a nice cushion, too.
There is a very real chance this is the new normal. Maybe we will never go back to pre-covid participation rates.
It might be the new normal, but is that the same thing as being strong?
Is an A in May 2020 the same as an A in February?
Part Timers
Another one of my harping points. The NFP number only measures the number of people on a business’s payroll, even if only for an hour a week. I’m old fashioned and believe full time jobs should carry more weight than part time jobs.
In Friday’s job report, the Household survey showed a gain of 691k part time jobs and a loss of 6k full time jobs.
But times they are a changing, right? “Part-time for economic reasons” measures who would prefer full time but can’t find it. Some people choosing part time work aren’t 25-year-olds wanting to live abroad and “work” four hours a day. For example, challenges with daycare disproportionately effect women, so they may be choosing part time work. The ability to choose part time work is a game changer for them.
Here’s a graph of “part time for economic reasons” (aka I wish I had full time but can’t find it) is pretty low. This is a compelling argument that the labor market is doing well. They are choosing part time work.
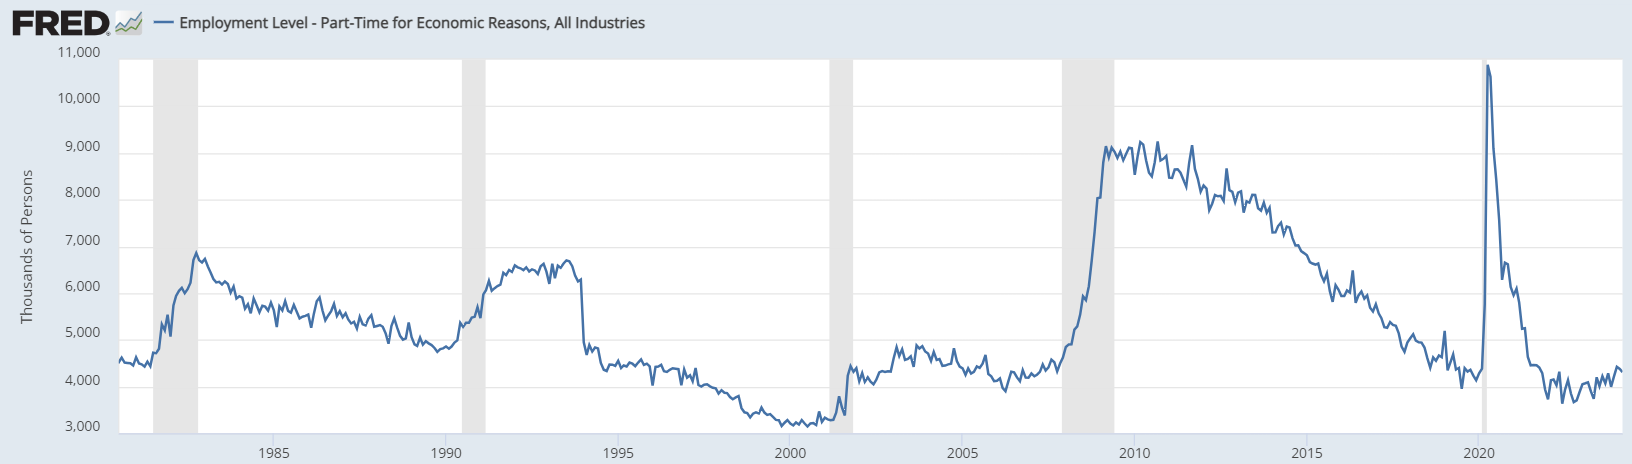
But…there is no lead time before this measure surges into a recession and they lose that choice.
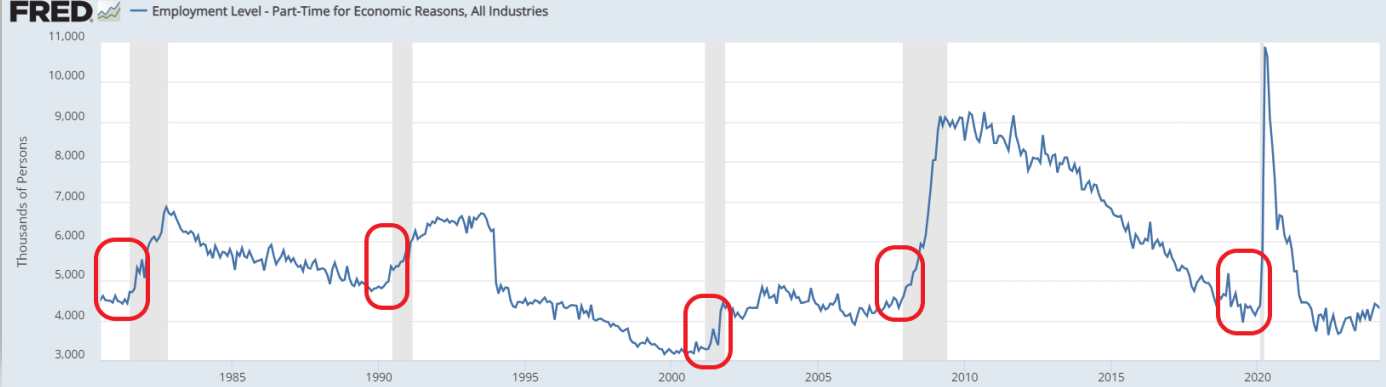
It might be the new normal, but I would be careful about assuming this new normal will continue forever.
Multiple Job Holders
We have never had more people with multiple jobs. On the one hand, that feels good because at least they have options. On the other hand, the trend seems to be that this peaks right before a recession.
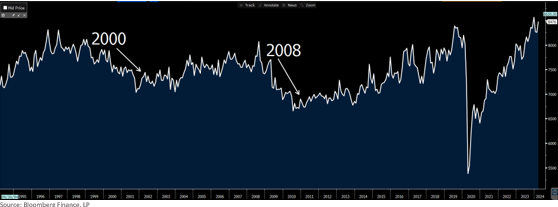
Maybe having multiple jobs adds up to something better than a single full-time job. But maybe it’s just to help offset inflation. Maybe it’s because we are losing full time jobs. Maybe we didn’t call the right people to learn they really want full time work. Speaking of calling people…
Response Rates
Turns out people don’t like responding to government surveys. Over the last 10 years, response rates have dropped from 65%+ to 40% or less. This is a key reason why we see such big revisions each month to the prior month’s NFP print. Thanks to SMBC’s research team for this one.
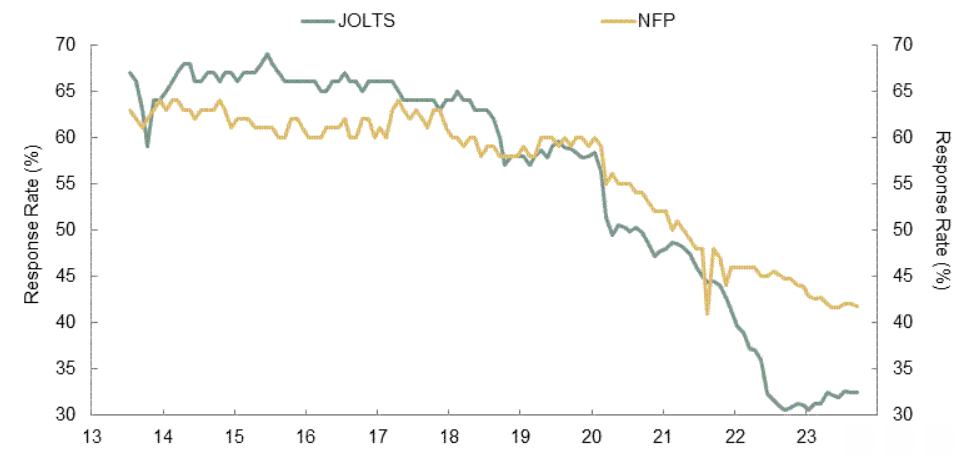
As I have said over and over again, I don’t blame the statisticians at the BLS or BEA - I blame us. They are doing the best they can with what they have, but we keep treating the data as if it’s the same quality as it was 10 years again. Unless the government starts providing free tix to a T-Swift concert, I think these response rates are the new normal. It’s up to us to decide how much stock to put into each data print. To extend the heavy-handed analogy, I didn’t blame the teachers, either. They were the BLS statisticians caught up in our mess.
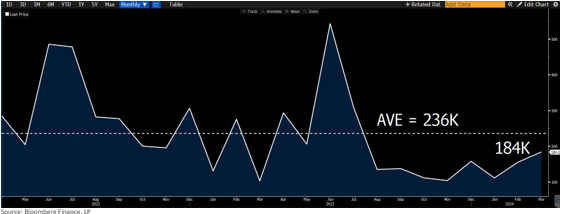
Government vs Private Sector
Are government jobs the same as private sector jobs? I would argue they are not since they are dependent on my tax-payer dollars.
That red hot job gain last month of 303k? Half of it was from government and healthcare. Backing that out, we gained about 150k private sector jobs. That’s still a good month! It also ties out nicely with ADP’s own estimate of private sector jobs gained last month of 184k. Good, but not gangbusters.
Sugar Rush
Post-covid, I agreed with all the rounds of stimulus. The GFC taught me we were going to pay the price one way or another. We could either drag it out for 10 years or go all-in. I appreciated the bold measures to protect Americans. Here’s a quick recap of the fiscal response.
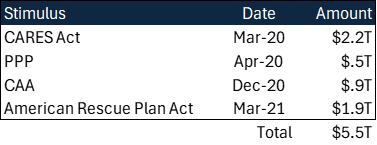
Of all those rounds, the March ‘21 stimulus is the one I wish I could get back. That’s the one that got passed after Democrats won two Senate seats in a runoff, giving them the needed majority (and should serve as a cautionary tale for Trump supporters this year). Scott in Dallas emailed me saying it was too much. I disagreed. He likes the Cowboys - how smart could he be?
Any discussion about the strength of today’s economy should have to factor in how all that stimulus contributed to today’s strength and the future cost. Below is a graph of Federal government interest payments - that’s money that could have been spent elsewhere. What’s the opportunity cost? I think it’s too soon to know, but I think we should be careful about bragging about the state of the economy after throwing all that support at it.
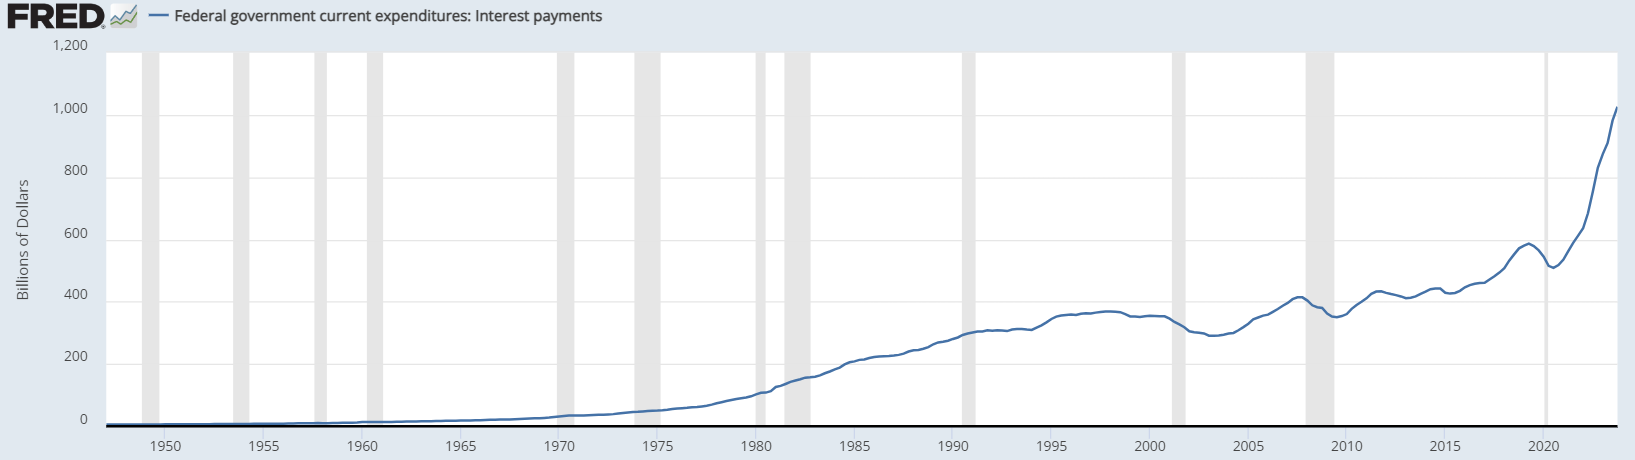
This brings me to my concern…if the current strength of the economy is built on the back of record setting federal spending, what’s the off ramp? Is the baton being passed to the private sector or is this spending the new normal?
Sure, my kids got straight A’s for a while, but did that make them better off in the long run?
Just as importantly…those arguing that the economy is doing great are doing so with backward looking data. Maybe it is doing well, but all that data proves is that it was doing well.
What happens if the economy wobbles? How do all the talking heads feel about the sizzling economy if the unemployment rate climbs to 6%? Recessions are non-linear events and we are ill-equipped mentally to account for the probability of a sudden weaking.
It’s all fun and games and charts and graphs until people start losing jobs.
You know who thinks choosing part time work is sign of labor market strength?
People that have never fought to keep a private sector job during a recession.
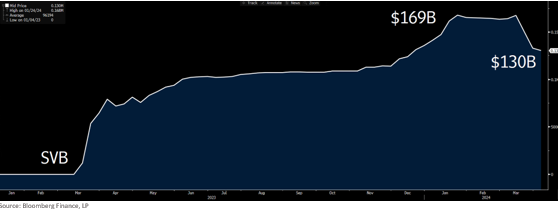
Bank Term Funding Program
Good news – banks are repaying the money they borrowed post-SVB! This may have knock on effects for lending liquidity, but that’s better than a banking crisis.
The Week Ahead
CPI is expected to show a tick back up because of the change to the shelter component weighting, but Core CPI is expected to drop to 3.7%. Lots of Fed speeches and FOMC minutes, too.
Oh, and UConn wins another one. The most underrated program of all time.