

If you are a floating rate borrower, this newsletter is for you. Permanent borrowers can eject here – see you next week.
With the end of the Fed tightening cycle nigh, we went back to see how LIBOR behaved once the Fed was done hiking. Was a pause followed by another tightening cycle? Or did LIBOR fall?
Also, interest rate cap prices are higher despite a newly dovish FOMC – what’s the deal? We examine why cap prices aren’t falling as rates fall.
Last Week This Morning
- 10 Year Treasury started and ended the week at 2.70%
- German bund ticked up slightly to 0.24%
- 2 Year Treasury started and ended the week at 2.54%
- LIBOR at 2.51% and SOFR at 2.43%
- Goldman and JPM recession models put a 50% probability of a recession in the next year, while BofA models put it at 64%
What Typically Happens After the Last Rate Hike?
The market thinks the Fed is done hiking. The Fed claims to have two more hikes left. Maybe we fall somewhere in between. Either way, it’s clear that this tightening cycle is nearly done.
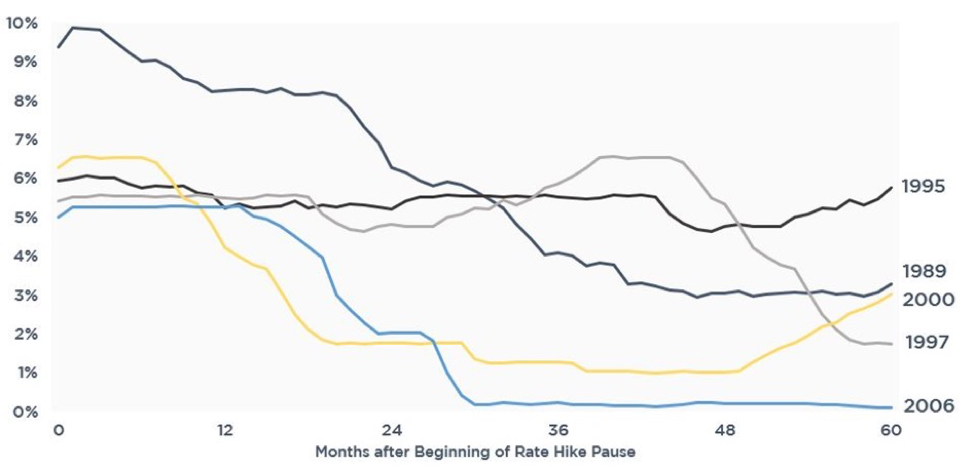
So what typically happens after the Fed stops hiking? Here’s a graph of what LIBOR did in the 60 months following the last rate hike over the previous 5 tightening cycles.
 Some Takeaways
- Over the 24 months following the last hike, LIBOR has never moved higher
- Over the same time frame, LIBOR was sometimes dramatically lower (as much as 4.0%)
- Over a 36 month time frame, only once did LIBOR move higher (1997)
Even during the outlier in 1997, after 12 months of hikes the Fed had to reverse course and start cutting rates dramatically.
This time could be different. The recovery and the pace of hikes has been much more gradual.
But it also seems possible that floating rate borrowers will have flat or lower LIBOR over the next 24-36 months once the Fed is done raising rates.
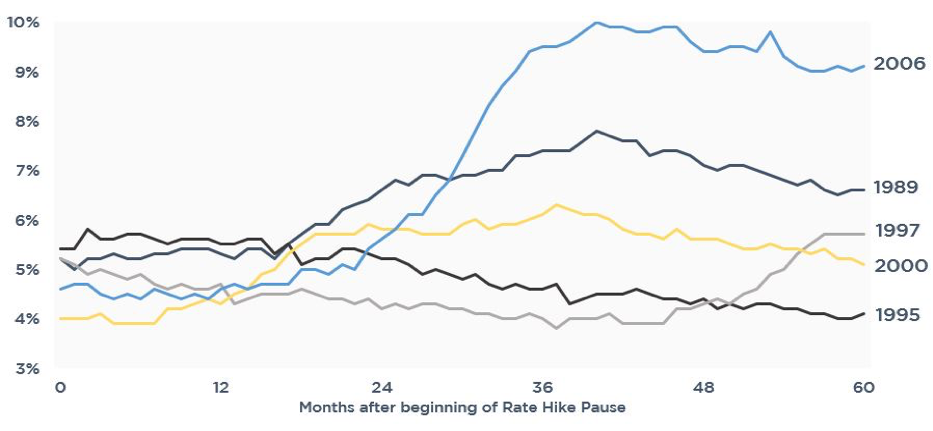
Just as notably, here’s a graph of the Unemployment Rate following the last rate hike. With unemployment bouncing along 50 year lows, keep an eye on whether it starts moving higher.
 Interest Rate Cap Pricing
The Fed has turned dovish, led by a dramatic 180 by Powell. The market is pricing in rate cuts this year instead of hikes. And even if the Fed is able to hike, we are clearly near the end of the rate hikes. It’s not like 4.0% is on the table.
So why aren’t cap prices going down?
The following analysis illustrates pricing for a $50mm 3 year at 3.00%. This is purely market cost – no trader adjustment, rating costs, transaction costs, or bank margin. But it gives a good sense of how pricing has changed as markets have changed. Also, one of the coolest features on our website is the Cap Pricer, where you can find a month by month breakdown of caplet cost vs caplet protection. That pricer does factor in those additional costs and does a good job of highlighting cost vs benefit. With that shameless plug out of the way, let’s dig in.
Cap prices are driven primarily by rate expectations and time value.
- Rate expectations – what does the market think LIBOR is going average over the term of the cap
- This average also happens to be how swap rates are calculated, so in many ways the swap rate dictates the cost of the cap
- At the Money (ATM) therefore is the same thing as the swap rate
- This average also happens to be how swap rates are calculated, so in many ways the swap rate dictates the cost of the cap
- Time Value – month 36 has far greater uncertainty than month 1, so there is far more value (cost) in the long dated months.
- This is why many borrowers choose to buy a two year cap initially and then buy the third year in the future after that time value premium has dissipated
- Volatility dramatically impacts the time value component, usually best expressed as variance.
- If the Fed says Fed Funds will definitely be 2.50% in month 36, markets don’t have to price in a lot of variance.
- But if the market thinks LIBOR could be 3.0% or 4.0% or 5.0%, the variance is much greater and the cost to hedge month 36 much higher.
We all know rates are much lower over the last month, and with the Fed lowering expectations it seems unlikely LIBOR will exceed 3.00% materially over the next 36 months.
And yet compared to last year at the same time, cap costs are higher.
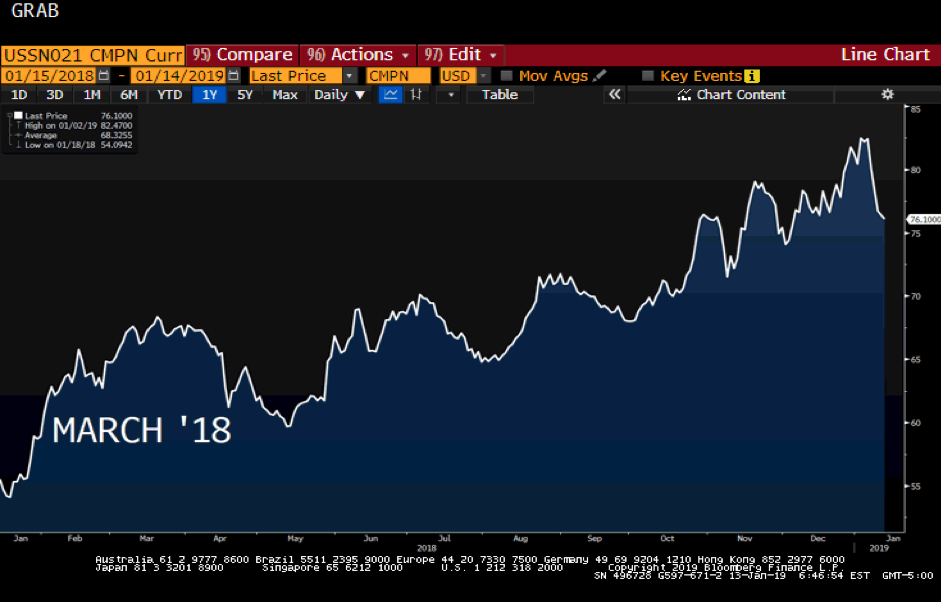
On March 5, 2018, the 3 year swap rate was the same as it is today – 2.46%. That should help eliminate any differences attributable to market expectations of higher rates.
Take a look at the cap cost today vs 10 months ago. We’ve also included where LIBOR was at that time as well as the peak LIBOR over the 36 month forward curve.

This cap costs $37k more today even though the swap rate is the same and peak LIBOR is actually 0.24% lower.
Why? Two reasons – volatility and the shape of the curve.
Volatility
Volatility is a huge driver of cap costs. Think of volatility as a whip being cracked. At the handle, only a small range of motion. But at the tip, there’s a much wider range of motion. That variance has a ripple effect through cap costs on a month by month basis. If month 1 is the handle and month 36 is the tip of the whip, it gets much more expensive for a trader to hedge month 36.
Look how much 3 year volatility is up over the last year.
Shape of the Forward Curve
Despite flat rate hike expectations, current LIBOR is still pretty close to the 3.00% strike in our example. So while the market may not think a 3.00% cap will have any payout, it doesn’t have to be wrong by much before the payout becomes painful.
Compare that to March 2018 when LIBOR was 1.68%. Even if the market was wrong, it would have had to be wrong by a lot before the cap started paying out with a 3.0% strike.
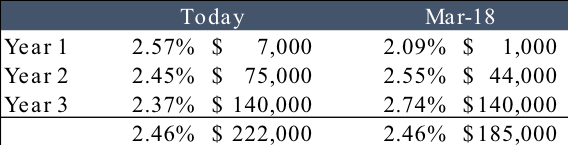
Here’s a year by year breakdown of the cap cost, today vs March 2018. Note that the average LIBOR expectations is the same in both (2.46%) and the third year costs the same ($140k).
That means the cost difference is really in years 1 and 2. And that cost is much higher today simply because LIBOR is that much closer to 3.0%.
Takeaways
If volatility settles down, cap prices could drop somewhat.
But until the Fed confirms it is on hold or suggests rate cuts are on the horizon, LIBOR is close enough to a 3.0% strike that the cost is unlikely to plunge any time soon.
And if the recent market panic passes and the Fed ultimately ends up being able to hike twice in 2019, the costs today could end up looking very attractive.
This Week
Much busier week than last week. Fed and ECB speakers, manufacturing and retail data, etc.
Obviously, news out of China will also dominate headlines.