

Last Week This Morning
- 10 Year Treasury down to 2.93%
- German bund down to 1.13%
- 2 Year Treasury at 3.13%
- LIBOR at 2.12%
- SOFR at 1.53%
- Term SOFR at 2.16%
- CPI (monthly) came in at 1.3% vs expected 1.1%
- This is not good news
- CPI (year-over-year) came in at 9.1% vs expected 8.8%
- This generates headlines, but is less of a focus right now
- Core CPI (monthly) came in at 0.7% vs expected 0.5%
- This is not good news
- Core CPI (year-over-year) came in at 5.9% vs expected 5.7%
- More bad news
- Producer price index (PPI) came in at 1.1% vs expected 0.8%
- Core PPI (month over month) came in at 0.4% vs expected 0.5%
- Yay!
Pesky Inflation
Last week was not a good one for inflation. I won’t rehash the headline grabbing data you’ve already seen, but instead focus on what I think the Fed is focusing on – monthly acceleration of inflation. Here’s the monthly version of the 9.1% inflation reading that was in the news last week.
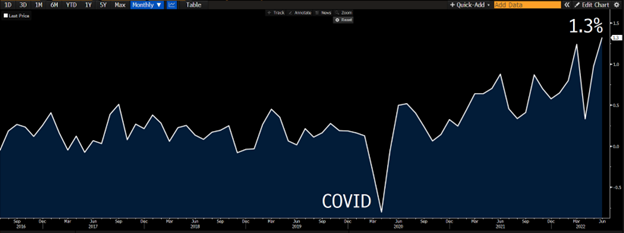 Source: Bloomberg Finance, LP
And then I say, “But the Fed prefers to look at ‘core’ inflation, which excludes food and commodities.” But that doesn’t look good either.
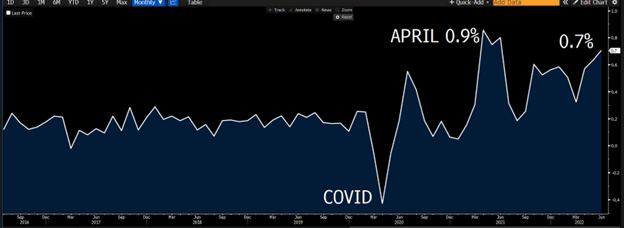 Source: Bloomberg Finance, LP
I’m going to set this m/m Core CPI aside for a moment, but please remember this data point when we talk about rate hikes later.
Now, because I’m a silver lining kind of guy, the next day’s PPI m/m core report showed a glimmer of hope. This captures the production side of pricing, rather than consumers, so it is generally viewed as more of a leading indicator.
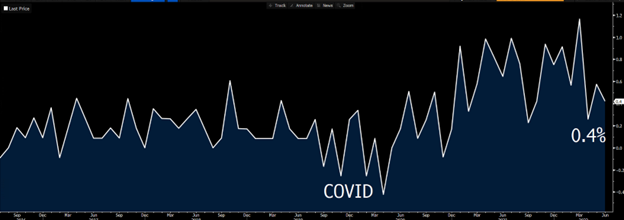 Source: Bloomberg Finance, LP
Inflation expectations, which are arguably more important than current inflation readings, are showing some relief.
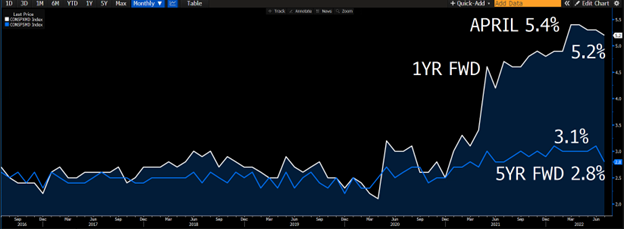 Source: Bloomberg Finance, LP
Meanwhile, supply chain issues continue to slowly improve.
 Source: Bloomberg Finance, LP
See? I told you I’m a silver lining kind of guy!
Floating Rates to 4.0% by Year End
While we are seeing some positive signs that inflation is potentially peaking, Powell won’t be able to change tune anytime soon. He really needs to break the back of inflation, otherwise he risks giving back the ground he is slowly gaining.
The market is pricing in almost a 50% chance of a 100bps hike on the 27th. Several Fed speakers came out and pushed back on this, so for now let’s take their word that 75bps is the base case scenario.
But even with that, it’s not hard to envision a scenario where Term SOFR is at 4.0% by year end.
Remember that month over month Core CPI I asked you to hold onto earlier? I think the Fed needs to see 3 consecutive monthly declines before it starts changing rhetoric. Because I’m a silver lining kind of guys, let’s assume that begins next month, putting mid-October as the third consecutive monthly decline if everything goes off without a hitch.
That would mean the November 2nd FOMC meeting would be the first real opportunity for the Fed to ease off the brakes. By then, rates are probably already at 3.00%.
That means two, 25bps hikes puts us at 3.50%.
While two, 50bps hikes puts us at 4.00% by 12/14/22.
In the table below, we assume 75bps this meeting and then outline a few different scenarios from there. For context, Term SOFR is 2.16% today and has mostly priced in the upcoming hike.
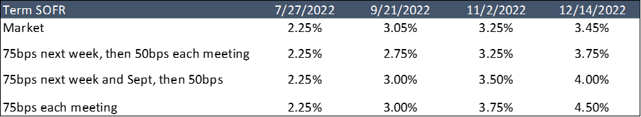
A month ago, the forward curve put SOFR at 4.0% in early 2023. The market has since backed off that, but there is a very real chance we see floating rates at 4.0% this year.
Yield Curve Inversion
Not all recessions are preceded by an inverted yield curve. But when it does invert, we have always had a recession.
The yield curve first inverted on April 1. The inversion reached 22bps. Doesn’t sound like a big deal, right? But the average inversion is just 16bps (Yield Curve Inversion Study).
From the time the curve first inverted, to the last day it went positive and didn’t invert again, was 488 days. That would be August 2, 2023. Forward rates show an inverted curve through September 2023. Sounds like we are following a pretty well-worn path here.
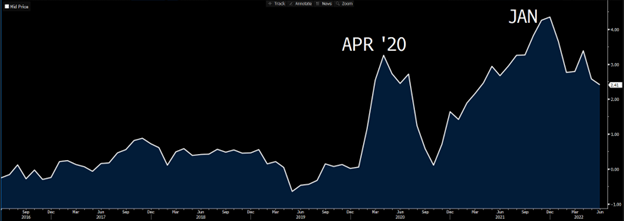
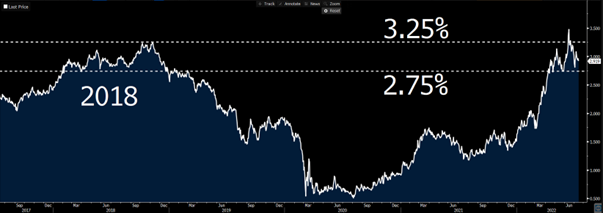
Keep in mind that if the market starts pricing in 4.0% Fed Funds, that does not mean the 10T needs to move higher. The 10T might be consolidating towards a range of about 2.75% - 3.25%, similar to what we experienced in 2018. Of the two, it seems more likely to break lower than higher.
- Break higher
- Market stops believing inflation is solely a near term phenomenon
- Markets stops believing the Fed is hiking us into a recession
- Break lower
- Market believes the Fed will have to hike more than expected to fight inflation, thereby exacerbating the pain on the other side
- Global recession
- Bubbles keep popping and continued flight to safety
 Source: Bloomberg Finance, LP.
Week Ahead
A blissfully light week of data following last week’s dumpster fire.