

Can we all agree that if we put Chick Fil A in charge of testing, we’d be leading the world in testing capabilities?
“Leaders Backtrack on Reopenings as US Coronavirus Cases Soar”
“Six States Reach Daily Highs as US Sets Record”
“US Coronavirus Cases Reach Highest Single Day Increase”
“A Quick Reopening, a Surge in Infections, and a US Recovery at Risk”
After reading those headlines on Friday, it’s clear we reopened too quickly. Cancel sports again. Send back my fall tuition check. We are home schooling for the 2020-2021 academic calendar year. Everyone is working from home for the next decade because the end is nigh…
Cases – US
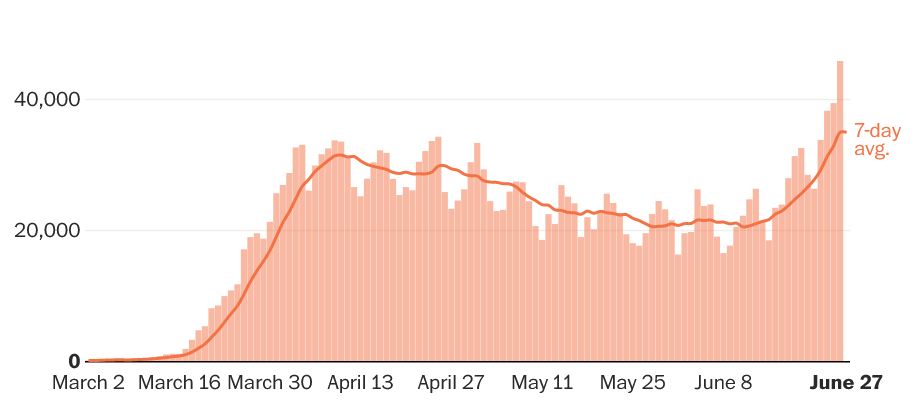
Here’s that Johns Hopkins graphic I love so much showing how our country should basically close up shop. Hey, 244 years is a good run..
But you know, before we call it the American experiment, maybe I should dig in just a bit and make sure we’re making the correct decision.
You know what I find interesting? All the headlines are about the record surge in cases, but we never see the # of deaths on the same graphic. I actually had to make this graph because none of the media outlets have it.
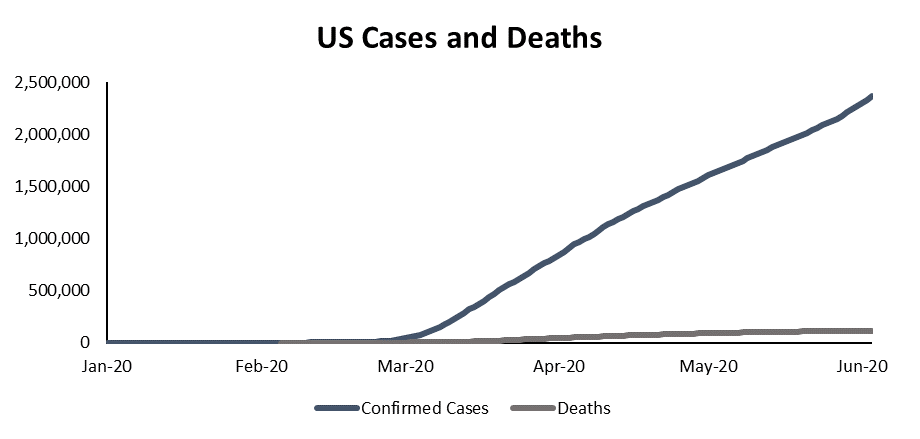
That doesn’t look as scary as the Johns Hopkins graphic to me.
In fact, isn’t this outcome completely intuitive? If the mortality rate is less than 100%, then the number of cases should increase dramatically more than the number of deaths.
On Friday, the governor of NC made masks in public mandatory for the next three weeks. I’m on record as saying that I believe the impact on lives saved by masks is overstated, but I applaud him for choosing that over shutting everything down again.
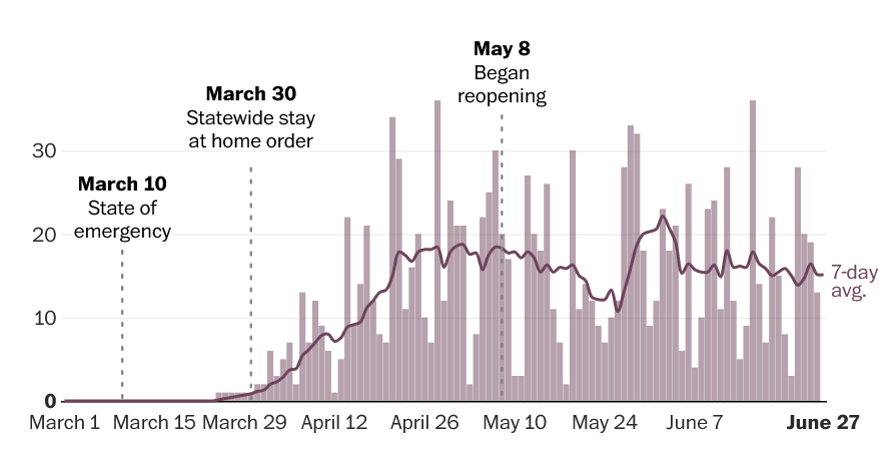
What led him to make this decision? Like much of the country that is trying to reopen, our number of cases is going up.
Cases – North Carolina
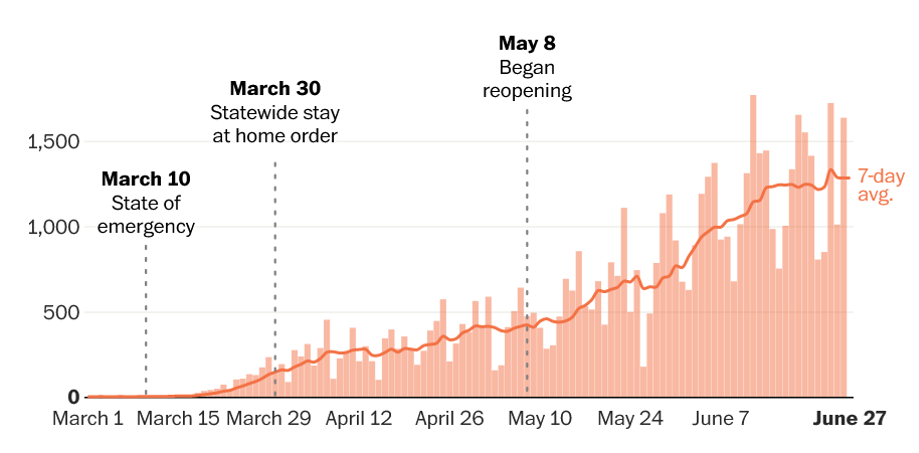
But why is this a shock? This was so predictable. Of course cases are going to increase when we try to start going about our daily routine. What’s going to happen over the next three weeks that will lead him to conclude, “OK, we don’t need the mandatory masks anymore”?
That was my problem with a quarantine from day 1. In fact, my “Why Flattening the Curve is Overrated” newsletter started with this very basic question, “Can you describe to me what the successful lifting of quarantine looks like?”
I think the recent obsession with # of cases is misplaced because the vast majority recover. I am far more concerned with hospitalizations and deaths. If the mortality rate of covid-19 was 50%, not one of us would be leaving the house right now. But it isn’t.
Here’s North Carolina’s chart illustrating deaths. It’s been flat for two months. Could there be a lag between the recent uptick and deaths? Sure. But our cases have been on the rise for quite a while and yet deaths have remained flat. Why are we only reacting to the number of cases?
Deaths – North Carolina
Just as importantly, North Carolina has a population of 10.5mm people and we have about 17 people dying per day from covid. We can all agree that it would be better if we didn’t lose anyone to covid, but I’m not sure 17 people out of 10,500,000 is as scary as it’s being portrayed. That’s .00016% of the population.
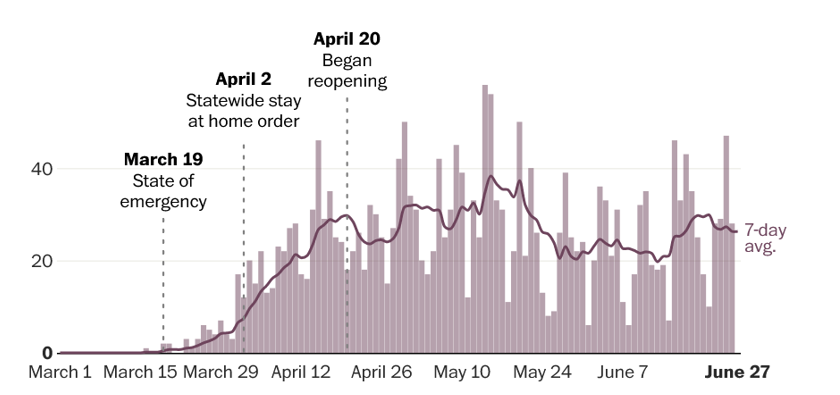
Texas was the state that was in the headlines the most last week. The governor closed bars again and ordered restaurants to operate at 50% capacity because cases are on the rise. I don’t necessarily agree with the decision, but I commend him on a more thoughtful approach than, “shut everything down.”
Cases – Texas
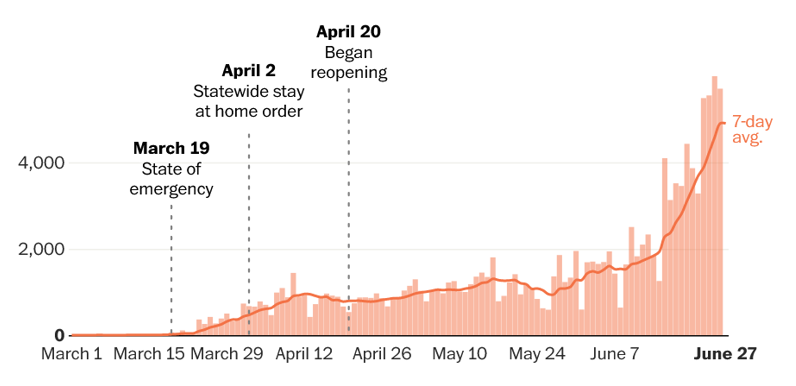
However, like NC, Texas deaths have been pretty flat for the last couple of months. And Texas started reopening two months ago on April 20th. Is he following the cases? Or the deaths?
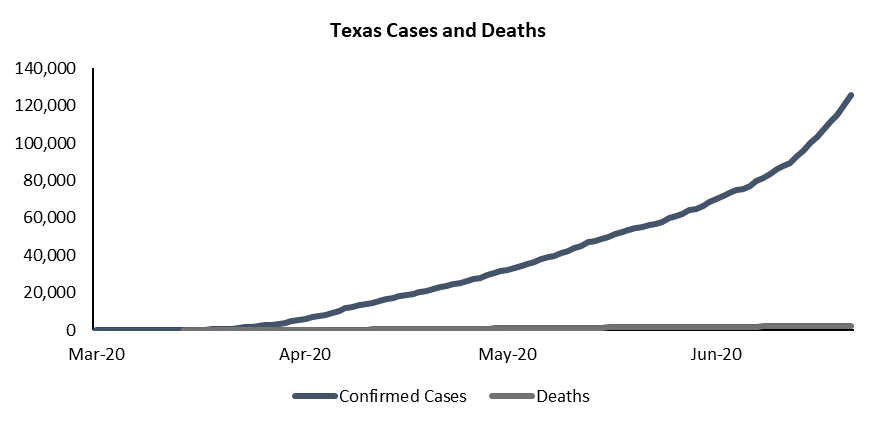
Deaths – Texas
Texas has a population of 29mm. Without trying to sound callous, 22 deaths is .000076% of the population. Here’s what total cases and deaths look like in Texas when we put them on the same graph – isn’t this what we would expect when dealing with one of the most contagious viruses in history?
“But JP, shutting down isn’t just about preventing an increase in cases, it’s about making sure we don’t overwhelm the healthcare system.”
Houston’s hospitals are apparently overwhelmed. It was in the news last week. CEOs of the largest hospitals in Houston signed a letter to locals warning, “If this trend continues, our hospital system capacity will become overwhelmed.”
They weren’t the only ones. Harris County Judge (which is basically the CEO of the county that Houston resides within) Lina Hidalgo, “The harsh truth is that our current infection rate is on pace to overwhelm our hospitals in the very near future,” Judge Hidalgo said. “We hope this serves as a wakeup call to everyone that the time to act is now.”1 There’s also a helpful graphic to support her advisory order for everyone to stay at home.2
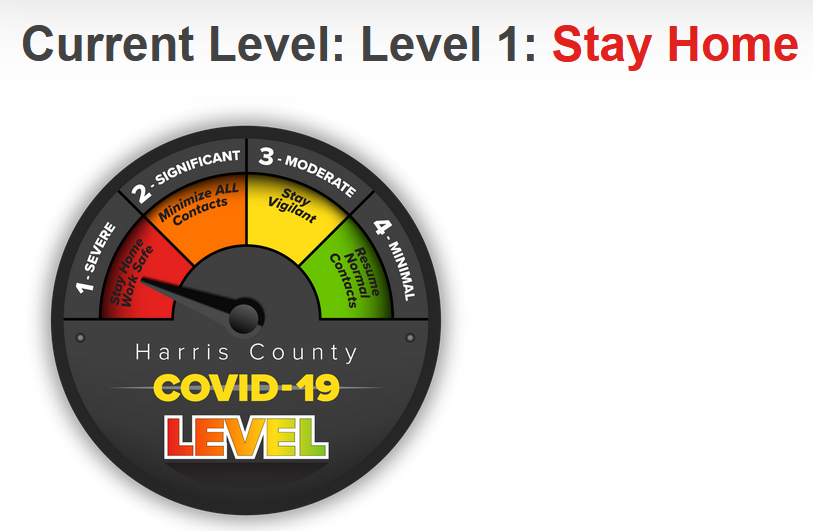
Cue shutdown headlines. Close stores. Lay off employees. Judge Hidalgo believes me callous, saying, “Since when did we decide as a society that instead of saving a life and preventing the spread of the virus, we would treat human lives, the lives of our neighbors as collateral damage to be dealt with?”
But she wants everyone to stay at home, while the governor is trying to prohibit those activities that seem to be the most dangerous. One approach is targeted, while the other is blanket.
I have a lot of good friends in Houston and I reached out to see what it felt like on the ground. One responded with an article that included a quote by one of those same CEO’s saying the purpose of the letter was to “urge people to do the right things in the community and do so by talking about capacity, but really ended up unintentionally sounding an alarm bell too loudly about capacity.” Well, that’s different.
He continued, “It is completely normal for us to have ICU capacities that run in the 80s and 90s,” Methodist Hospital CEO Dr. Marc Boom said. “That’s how all hospitals operate.” Plus, only 28% of the ICU patients are covid patients.3
“The spread is increasing and it’s very concerning. However, our hospitals are okay and ready to manage this surge effectively and appropriately,” said Dr. Doug Lawson, CEO of CHI St. Luke’s Health, CHI. “The reality is our capacity to care for those patients significantly exceeds what we’re staffing on any given day.”
Are Houston hospitals really overwhelmed? Or is the fear of covid so psychologically strong that the well-intentioned letter to Houstonians caused a knee jerk public reaction that caught the medical professionals off guard? And that public (over)reaction, in turn, pressured politicians to respond by shutting down again. It doesn’t sound like the hospitals are overwhelmed, yet we are responding as if they are.
The CDC has updated some data recently that is not getting enough attention. Are we so intellectually lazy that it’s easier to simply believe the headlines of our preferred news source? The same reason you are thinking about skipping ahead right now is the same reason politicians are responding to the data incorrectly. I’m not saying you’re just like a politician if you’re skipping ahead, but I’m not not saying it…
I’ve summarized their finds in the little charts below, but you can find theirs here. https://www.cdc.gov/coronavirus/2019-ncov/hcp/planning-scenarios.html
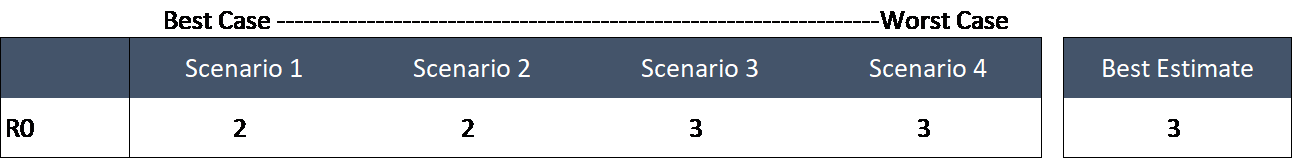
Quick explanation: Scenarios 1-4 are a range of outcomes based on increasing severity. So Scenario 1 is the best case, Scenario 4 is the worst case. Scenario 5 is the best guess.
Transmission
Let’s start with an easy one – R0. Transmission. Covid-19 likely has an R0 between 2-3. That is a very high number relative to other viruses. Coronavirus is very contagious. This is a big reason why covid is so much more dangerous than other viruses we’ve encountered. It’s also a big reason why I believe the spread is largely inevitable and these safety measures are more about providing the illusion of safety rather than real safety.
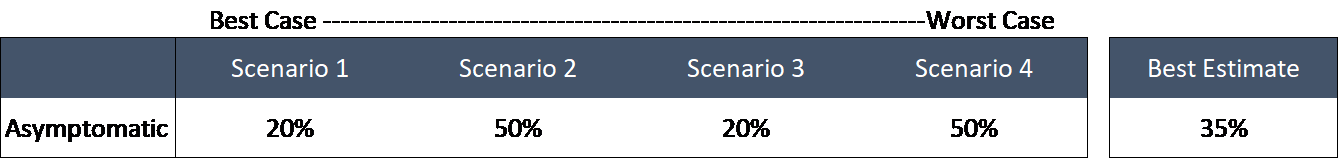
Asymptomatic
Here’s another easy one – what % of people have it and don’t know it? 20%-50%, with a best guess of 35%. That suggests far more are recovering than we are giving credit for, and the mortality rate is even lower than we believe.
Don’t skip ahead. We’re getting to the important ones.
Hospitalization
The overall hospitalization rate is 3.4%. This is the number we need to keep a lid on to ensure our hospitals aren’t overwhelmed. This is driven by the number of cases, hence the concern with the rising numbers.
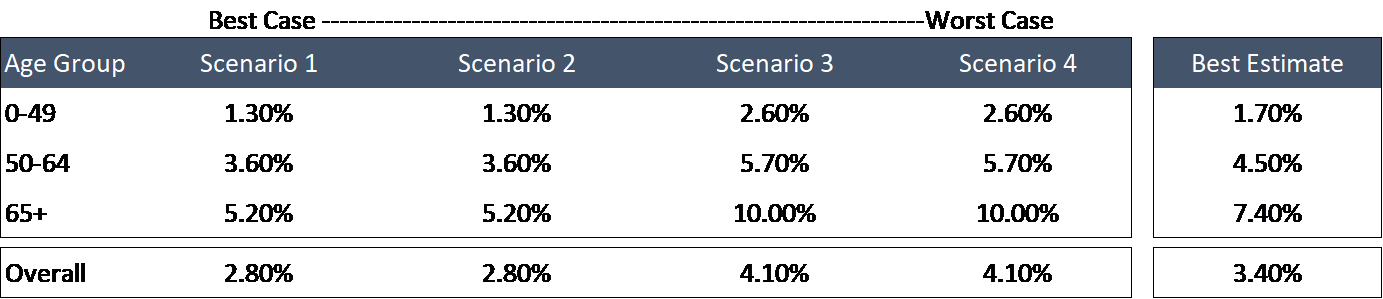
If you’re under 50 years old, the best estimate is that you would have a 1.7% chance of requiring hospitalization if you contracted covid. That’s uncomfortably high.
Let’s assume most of those 50 and older and voluntarily taking more precautions than most and aren’t the ones attending boat parties at Lake Travis. With 5,000 new cases a day across Texas, that means about 85 people a day require hospitalization. Start adding 85 people a day to Texas hospitals every day and you can understand why there is concern.
But a study in Singapore found that length of stay for hospitalizations for non-vulnerable patients was 7-11 days shorter than for vulnerable patients. Some only require a stay of two days.4 I’m not saying hospitals can’t be overwhelmed, but I want us to make sure we’re using accurate data to forecast those capacity rates.
Other tidbits:
- CDC, “Cumulative hospitalization rates for COVID-19 in adults (18-64 years) at this time are higher than cumulative end-of-season hospitalization rates for influenza over each of the past 5 influenza seasons.”
- This is why there is value in controlling the spread.
- CDC, “For children (0-17 years), cumulative COVID-19 hospitalization rates are much lower than cumulative influenza hospitalization rates at comparable time points during recent influenza seasons.”5
- I will continue to cite any stats that support getting my kids back in school.
Mortality Rate
This is the one I think we should pay way more attention to than total number of cases. This is what we should be basing decisions off of. The CDC’s best estimate for covid’s mortality rate across all age brackets is 0.4%. As a frame of reference, the seasonal flu is usually around 0.1%. In other words, about 4x deadlier.
- For those that say it’s just like the average flu, it’s not
- For those that say it’s just like the second coming of the Spanish Flu, it’s not
If you’re under the age of 50, the mortality rate is around 0.05%.
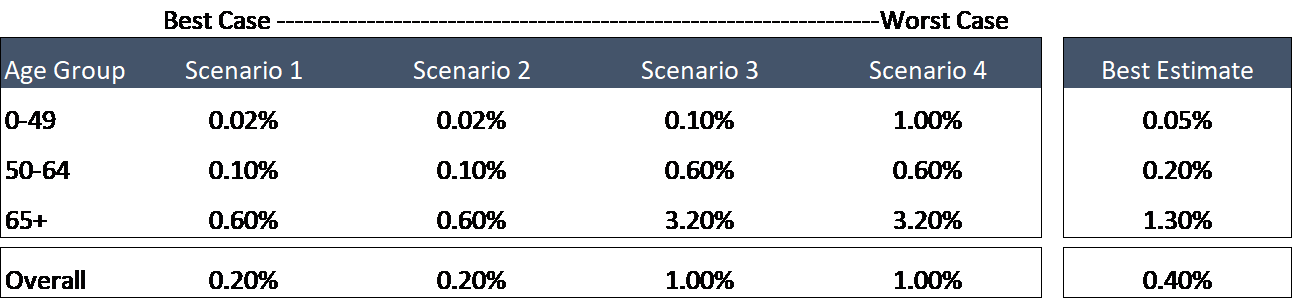
Remember all those dire forecasts of 4mm Americans dying? They were based on a mortality rate of 3.2%. Right now, the CDC’s best guess is 0.4%. Strip out those with underlying conditions. Or address the fact that the CDC estimates at least 35% of all covid positive Americans are asymptomatic. The real numbers fall further.
Just three months ago, Business Insider (not exactly a leftist rag), reported, “While about 0.1% of people who get the flu die, the coronavirus’ global death rate is about 4.7%, based on the current numbers of cases and deaths. However, the death rate of the coronavirus fluctuates constantly and varies strongly by country — in Italy, it was above 11% as of Monday, while it was 1.8% in the US.” A mortality rate of 4.7% would be unprecedented.
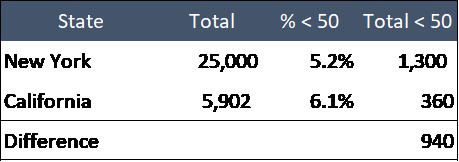
But in California, there have been just 360 deaths among those under the age of 50. That’s not a typo.6 That age bracket has a population of 26.5mm
Meanwhile, there have been over 2,600 deaths in the age bracket of 80+, yet that demographic has a total population of just 1.5mm.
“That’s because we shut down so rapidly!” – CA reader.
While Governor Newsome deserves credit for the absolute level of deaths, the distribution of deaths as a proportion of population is shockingly similar to New York’s.7,8 And as you can see, his faster response may have helped save 940 lives. That’s great, but I way smaller than I would have expected.
My macro takeaway – it’s not a shutdown that is keeping us safe, it’s our own immune systems.
The Spanish Flu was the worst pandemic in modern history, effecting a third of the world’s population with a mortality rate of 2.5%.
With about 65% of the US population under 50 years old, let’s run some numbers.
Total Americans under 50 years old 214,500,000
33% Infected 70,785,000
Mortality Rate 0.05%
Total Deaths 35,393
That’s terrible. I don’t want 35k Americans to die. But I do think it’s important to maintain some perspective when making decisions. And before Judge Hidalgo emails me accusing me of callousness, I would simply ask where that same level of concern has been for annual opioid deaths (42k). Suicides (49k). Auto fatalities (37k).
Is covid capturing our attention because it might happen to us, while those others are happening to them?
Perhaps our response to covid says more about us than it does about the disease?
Three months ago, I felt like we were overreacting. But at least policy-makers could be excused for acting out an abundance of caution. What would our excuse be today knowing what we know now? Why are leaders using a blunt approach when we have enough data to begin using a scalpel?
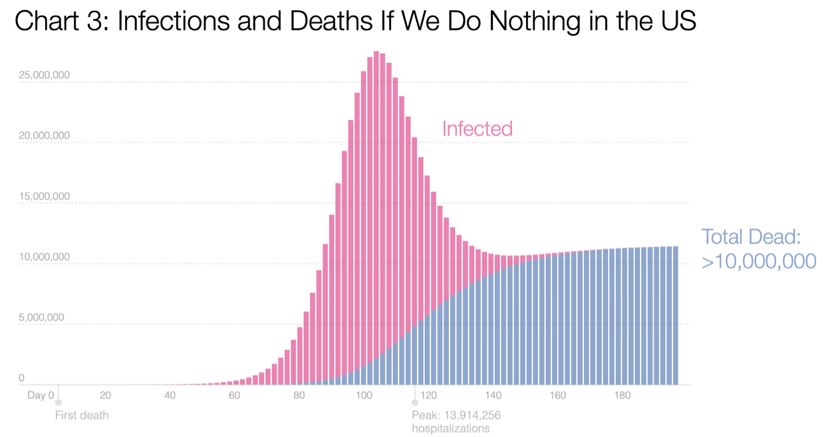
You may remember seeing this article (or at least my reference to it) from March because it got a lot of love. The Hammer and the Dance. People were eating it up.
It was also very scary. The author suggested total American deaths > 10mm within 200 days if we did nothing. It had an interactive graph with some cool input controls underneath it to allow you to play with assumptions like R0, mortality rate, effect of a shutdown, etc. This made if feel very scientific. Factual. Rooted in data.
Here’s why I hated that graph. It assumed a hospitalization rate of 14%. The mortality rate assumption was 4%. Any rational discussion about mortality rate in the early stages of covid should have convinced people it was simply impossible to have a 4% mortality rate, but rational thought wasn’t in abundance. Fear was. And graphs like this played a large role in that. I got crushed by suggesting the mortality rate had to eventually end up below 1.0%.
It’s been 102 days since he wrote this. Does anyone still believe that had we done nothing, we’d be well on our way to more than 10mm deaths in America? Can you honestly look me in the eye and say our response has saved 9,875,000 lives? What decisions were made back then out of an elevated, but incorrect level of fear? If we had asked ourselves, “How should we respond to something that is twice as deadly as the seasonal flu for the vast majority of Americans?” Couldn’t we be making the same mistake again now?
Here’s how that same graph looks with the current inputs from the CDC. It’s tough to see the fine print, but the total deaths are 253k. That’s terrible. I hate that we are having a discussion about Americans losing their lives.
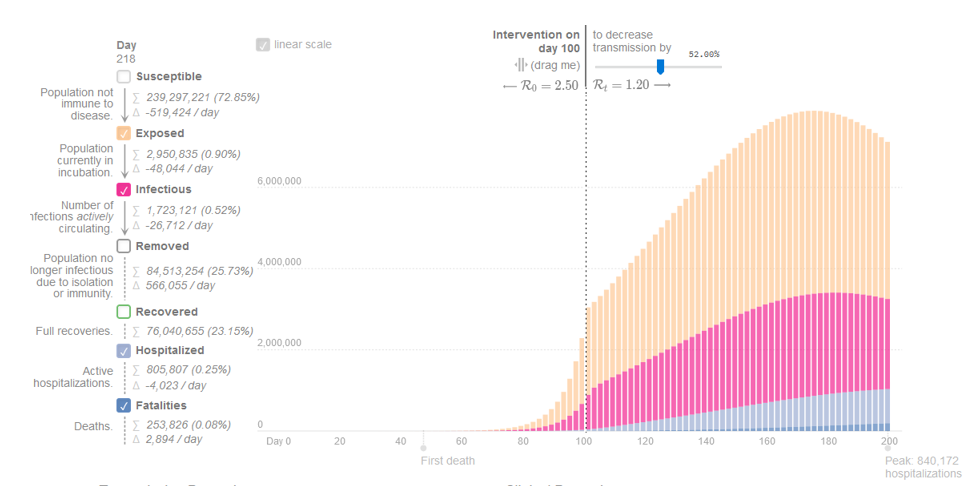
But 253k is a far cry from 10mm. And for some context, recall that heart disease kills about 650k Americans each year. That still assumes the hospitalization and mortality rate are capturing every person that has contracted coronavirus, but we know that at least there’s at least 10x the number of actual cases. That means those numbers will ultimately be even lower.
Takeaways
While the total number of cases is important, it needs to be put into context. For each new 100,000 cases of among people under 50, we are likely to have about 50 deaths.
Covid is extremely contagious, and that high transmission rate is contributing to a much higher level of absolute number of cases/hospitalizations/deaths. Even if covid is comparable to the seasonal flu for those under 24 years of age, the contagiousness leads to higher total numbers, which is what gets the headlines. That, in turn, drives the political response.
We have enough information to begin using a more precise approach. I am growing tired of politicians telling me to “follow the science”, as if I’m not. Just because I don’t believe a full shutdown is effective doesn’t mean I’m not following the science. Was Governor Cuomo “following the science” when he demanded 30,000 ventilators?
Let’s make sure the “science” we’re following isn’t really just politics dressed up in a lab coat.
Somehow, the goalposts have been moved on us. The original need to flatten the curve was to ensure we didn’t overwhelm the hospital system. Now it seems like the goal is to do whatever it takes to avoid any loss of life. Admirable, but not realistic. If Houston medical leaders are telling us they have the capacity to handle a surge, why are we shutting down again?
Alternatively, if those some medical leaders or the data changes and it turns out we do need to intervene more aggressively, we need an open mind to doing so. For some reason, coronavirus is closely linked to our political affiliation and that means we are not likely to change our mind.
With a blunt approach, we continue to do permanent damage to the economy. More and more layoffs will become permanent. Businesses will close for good. Entrepreneurship will suffer.
Cases rising isn’t inherently a bad thing. We are dealing with one of the most contagious viruses in history. It’s going to do what it’s going to do – spread. Let’s not treat each new positive case as a death sentence. More importantly, let’s not make decisions that assume as much.
That doesn’t feel like “following the science” to me.
That feels like following the fear.
Sources
- https://abc13.com/stay-home-work-safe-order-lina-hidalgo-coronavirus-texas-reopen/6270984/
- https://www.readyharris.org/Stay-Safe
- https://www.khou.com/article/news/health/coronavirus/houston-hospitals-ceo-provide-update-on-bed-capacity-amid-surge-in-covid-19-cases/285-a5178aa2-a710-49db-a107-1fd36cdf4cf3
- https://www.medrxiv.org/content/10.1101/2020.04.17.20069724v4
- https://www.cdc.gov/coronavirus/2019-ncov/covid-data/covidview/index.html
- https://www.cdph.ca.gov/Programs/CID/DCDC/Pages/COVID-19/COVID-19-Cases-by-Age-Group.aspx
- https://www.silive.com/coronavirus/2020/04/coronavirus-state-issues-list-of-3565-deaths-by-age.html
- https://www.health.ny.gov/statistics/vital_statistics/2010/table01.htm