

If you can lock in a long-term fixed rate below your current floating rate – should you?
You guessed it. We are bringing this one back now that fixed rates are lower than floating rates. The takeaway - an inversion is usually the absolute worst time to lock in a fixed rate.
Historical Perspective
Since 1990, there have been six periods of inversions including the one we’re in now. We’ve noted 6 month averages of GDP and the Unemployment Rate heading into the inversion to resolve the question of “sure, but was the economy doing as well then as it is now?”
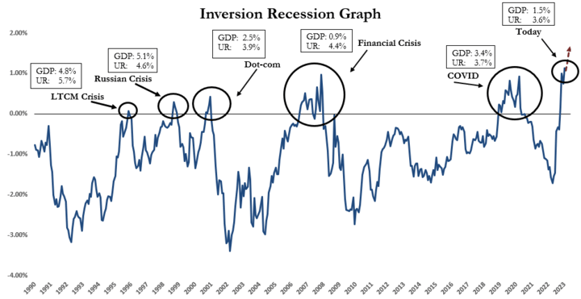
That’s the easiest graph in this article but bear with us. We’ll look at each one of those inversions individually, explaining the Pre-COVID and financial crisis inversion in detail, then apply the same analysis to the other inversions.
We selected 5 year fixed rates to serve as a compromise between 3 year fixed and 10 year fixed. The 10 year fixed was even more punitive than the 5 year. So, don’t be left wondering about those longer term scenarios.
Pre-COVID
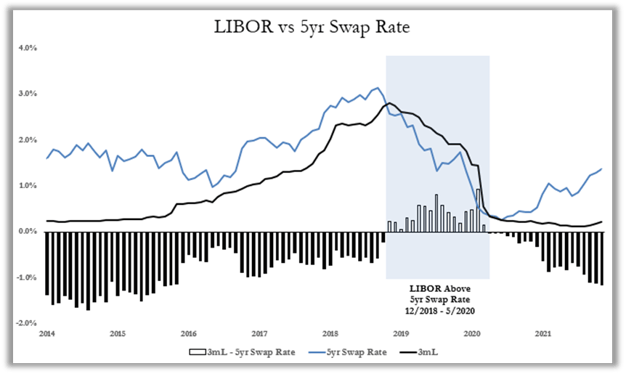
From December 2018 until May 2020 (17 months), most borrowers could lock in a fixed rate below their floating rate. Think about that for a second – for a year and a half borrowers locked in below floating.
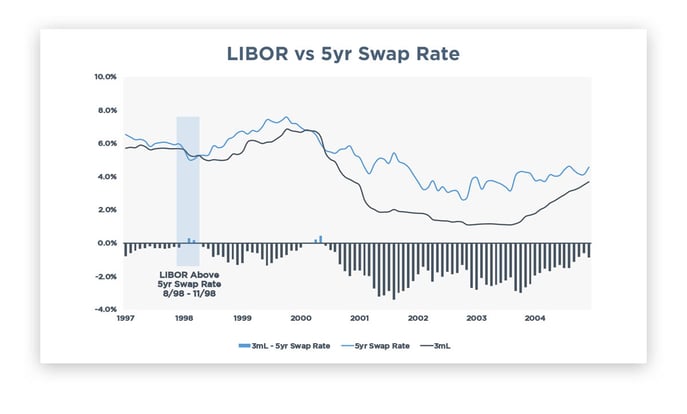
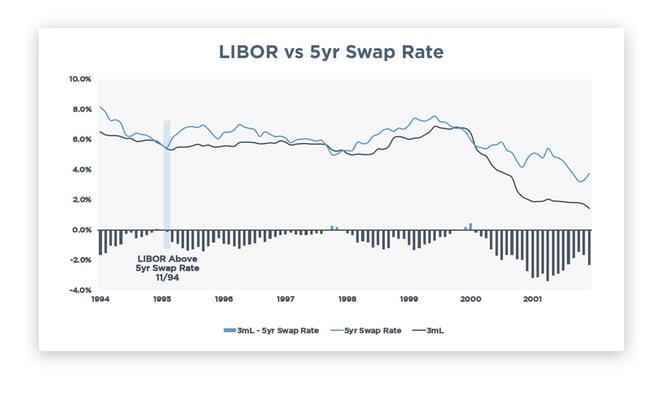
- The blue line is the 5 year swap rate
- The black line is LIBOR
- The bars represent LIBOR minus the 5 year swap rate
- The blue shaded box simply highlights the period of the inversion
Now let’s look at what would have happened if you would have locked in a fixed rate at 2.57% vs where you could have ended up floating for the next five years. Lots of red (aka missed savings) until August 2022.
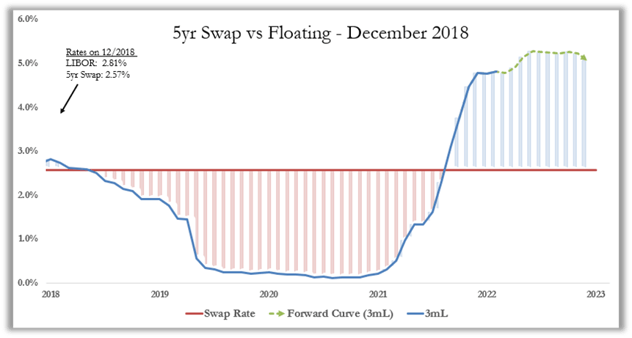
The Pre-COVID inversion was unique in that you may wind up indifferent between fixed and floating; however, we aren’t able to fully evaluate this just yet since 5 years have yet to pass since the start of this inversion. Excluding a minimal amount of savings in the November 1994 inversion, this may be the only case where you would wind up materially indifferent.
Next, let’s take a look at the previous inversions and how they actually played out.
Financial Crisis
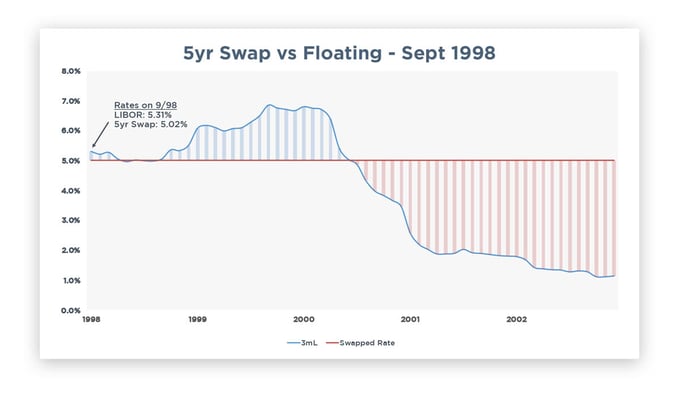
From July 2006 until December 2007 (another 17 months), most borrowers could lock in a fixed rate below their floating rate.
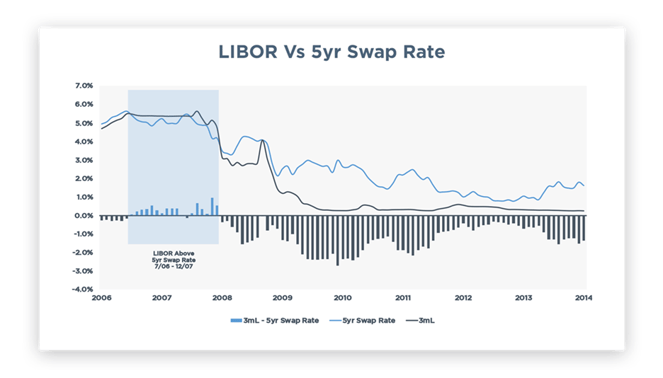
Let’s look at what happened if you locked in a fixed rate at 5.00% vs where you could have ended up floating for the next five years. Lots of red. Lots. Of. Red.
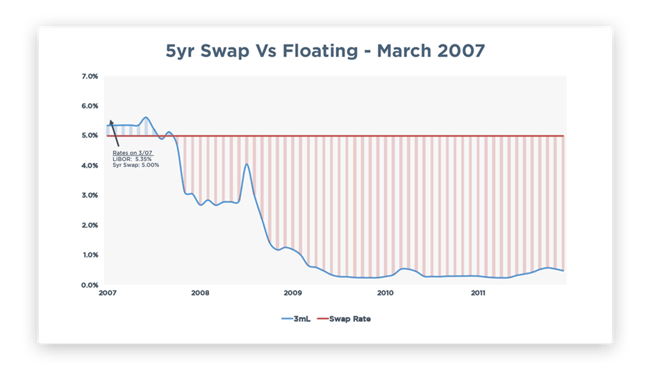
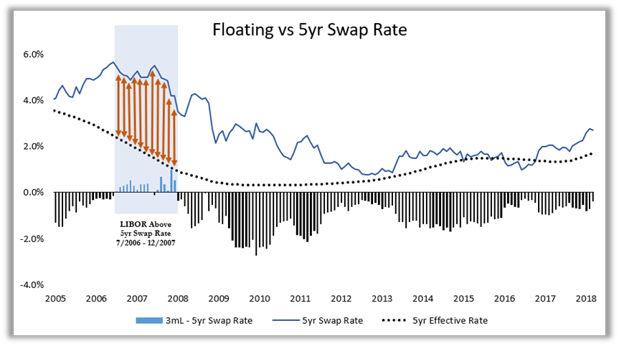
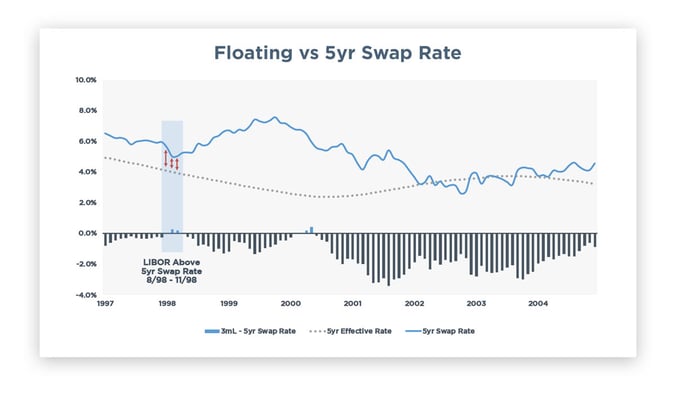
This graph takes some explaining – don’t skip ahead!
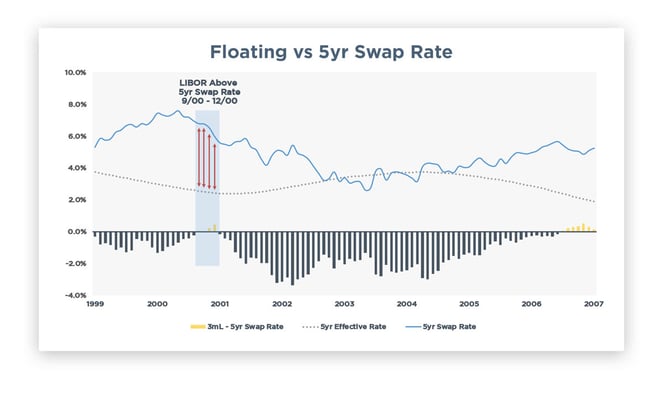
- The blue line is the 5 year swap rate just like above
- The dotted line is what your effective rate over the next five years would have been had you stayed floating
- The dotted line is NOT LIBOR
- If you pick any point on the blue line and then follow the red arrows straight down, that point directly below the swap rate tells you what your effective rate would have been if you had stayed floating instead.
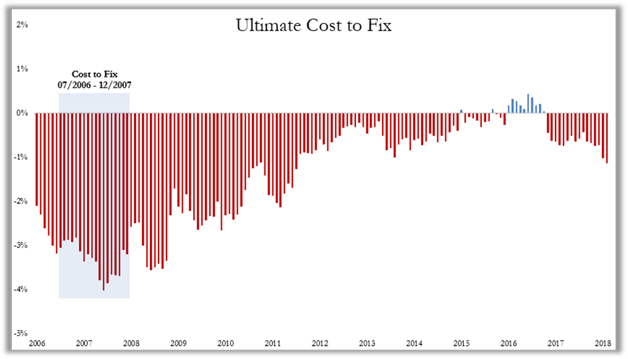
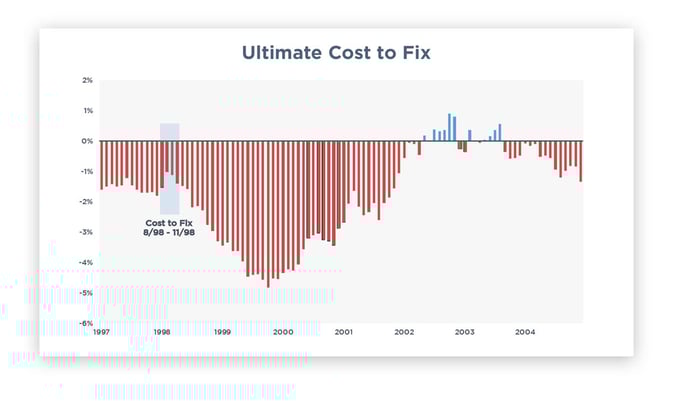
The next graph also takes some explaining.
- The red bars show how much you overpaid over the next five years
- Again, this is not a time series. If you pick the most negative bar, that means had you fixed at that moment, you ended up overpaying by 4% per year over the next five years
- The most expensive time to lock was during the inversion (shaded box)
2007 Inversion Conclusions
Borrowers that locked during the inversion leading into the Financial Crisis overpaid by as much as 4% per year going forward.
This also led to much higher prepayment penalties across various fixed rate debt types, preventing borrowers from refinancing to take advantage of lower rates.
We are all hopeful the financial crisis is a once-in-a-generation type of downturn, more severe than its predecessors, so couldn’t this be an outlier? Let’s take a look at the other inversions.
Dot-Com Crash
The inversion only lasted six months and was not as steep as the 2007 inversion.
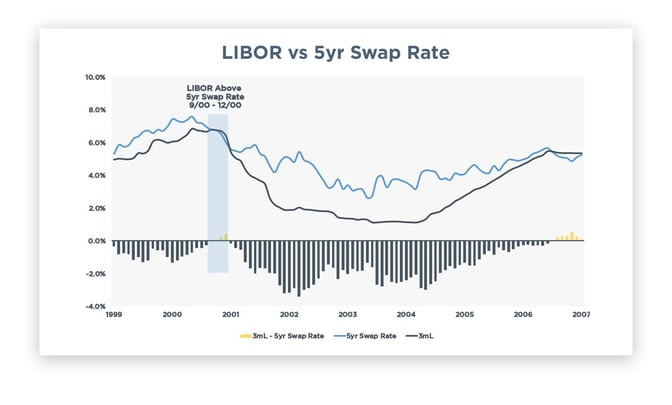
But a borrower that fixed still missed out on lower LIBOR in the subsequent years. Here’s that fun graph with lots of red showing how much in savings borrowers missed out on.
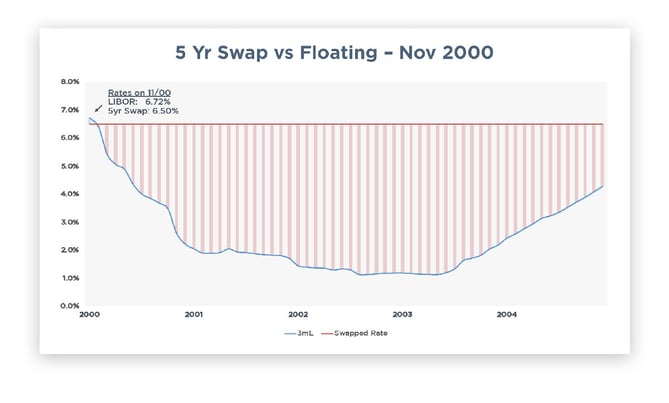
If you locked in at the blue line during the inversion, follow the red arrows down to see what your effective rate for the remaining term would have been had you remained floating.
The period immediately prior to the inversion ended up being the most expensive time to lock, but the inversion was still pretty expensive.
Russian Crisis
Three month inversion and relatively mild. It’s a bit more challenging to draw conclusions because it leads right into the more severe Dot-Com inversion.
Not quite as punitive as previous inversions, but still a net loss for borrowers that fixed rates.
That being said, borrowers still would have been better off floating by about 1.00%.
The inversion wasn’t the worst time to lock because we rolled into the dot com inversion, which was more punitive.

3% Rate Hike
The Fed hiked 3% in 1994, pushing Fed Funds from 3% to 6%, leading to a brief inversion in the same year.
If you locked in during the inversion, here’s what your floating rate looked like over the next five years – basically breakeven.
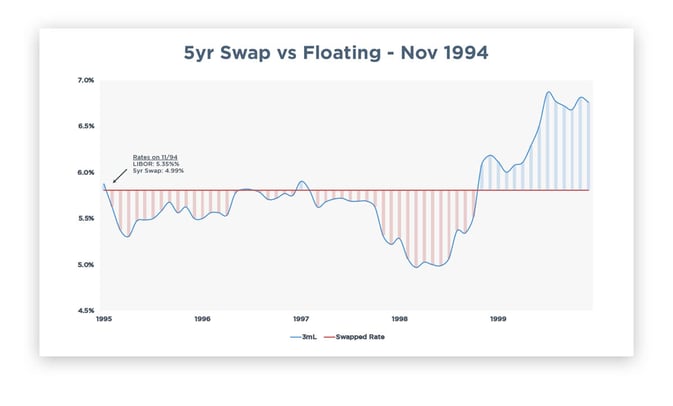
The brief one month inversion essentially resulted in rates that a borrower would have been indifferent between. The swap rate and the ultimate effective rate ended up being the same.
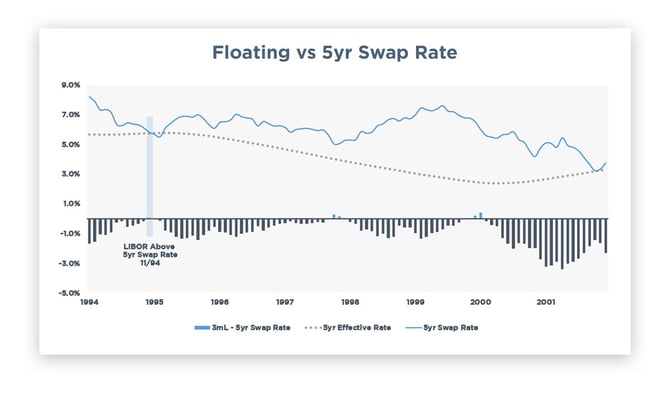
Because the Fed hiked so rapidly in such a short amount of time (3% in one year), the inversion actually wasn’t the worst time to lock.
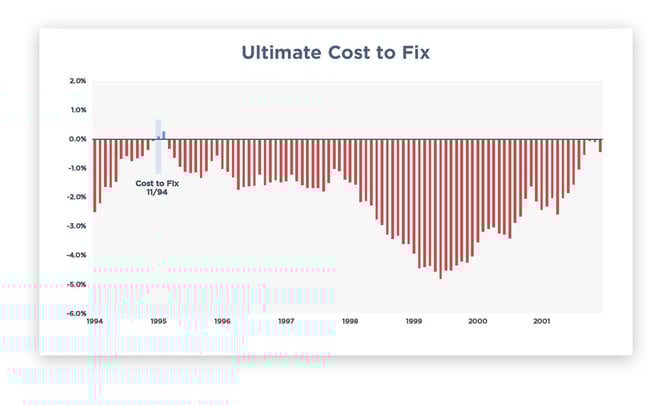
It’s important to note that while a borrower was no worse off fixing during the inversion of 1994, they weren’t really better off, either.
Therefore, is the best-case scenario really just breaking even?
Takeaways
- An inversion has historically been one of the worst times to fix a rate
- When floating ended up being the wrong choice, it was wrong by a little
- When fixed ended up being the wrong choice, it was wrong by a lot
- Even during the 1994 inversion, borrowers that fixed didn’t necessarily win, they broke even
- The longer the rate is fixed, the more you eventually overpaid
- 2 or 3 year fixed wasn’t as punitive because they matured quickly and you reverted to floating, recapturing some savings
- 10 year fixed is even more punitive than 5 year fixed
Caveats
- For the purpose of this analysis, we're not accounting for spreads, hedging costs, transaction costs, or prepayment penalties
- Maybe this time actually is different
- Or maybe it is just like 1994 and will result in a decision that yields a breakeven result
- During the financial crisis, clients locked at 5.00% and missed out on 0%. Maybe missing out on lower LIBOR/SOFR won’t feel quite as harsh when the fixed rate is 2.50% instead of 5.00%
- We used 3 month LIBOR and semi-bond swap rates because historical data is more readily available than for 1mL or SOFR, but we would expect the results to be materially similar
- This does not account for floors
Conclusion
This is not a recommendation to avoid fixing a rate. Each borrower and every situation is unique, and in some cases the certainty of a higher fixed rate may outweigh the potential savings from floating.
Borrowers that plan on holding for 5-10 years and won’t be frustrated missing out on lower floating rates or a potential prepayment scenario won’t get an argument from us.
But before you pull the trigger on a “no brainer” fixed rate, carefully consider the historical track record of locking in during an inversion.
